

Hims & Hers stock declines as weak momentum aligns with strong selling pressure

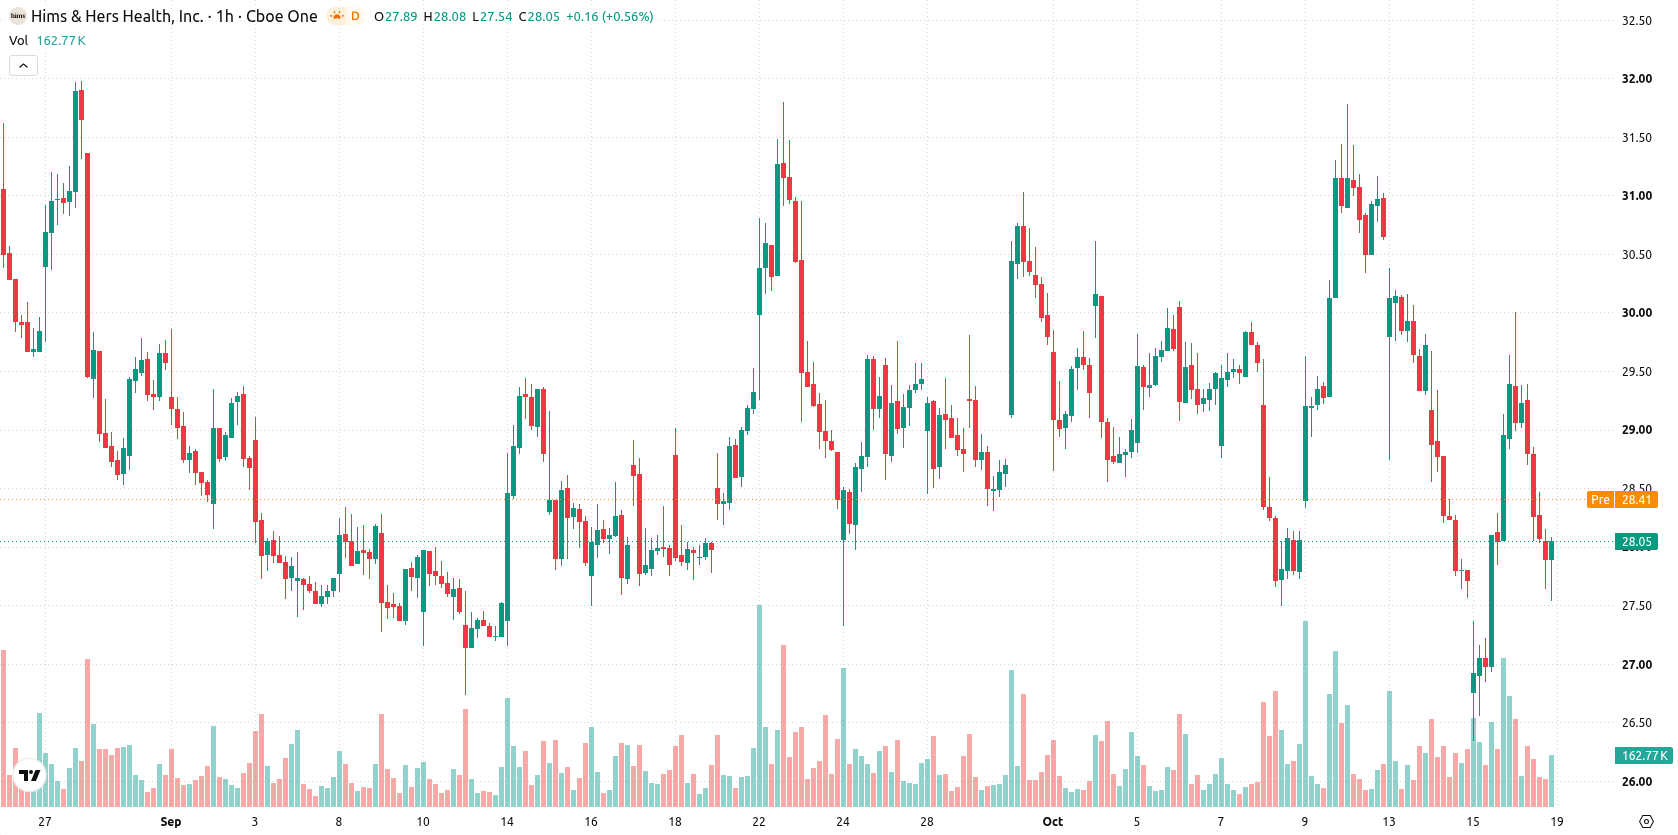
Hims & Hers (HIMS) stock is trading at $28.07 after declining 4.49% on the day. The move leaves the price below its short- and medium-term moving averages but above its long-term trend level.
 30.13
30.13
Highlights
- HIMS/USD is trading below short- and medium-term moving averages but remains above its longer-term support level.
- Multiple momentum signals are bearish, with recent intraday action showing a high-volatility 4.49% drop and strong seller control.
- Price is expected to move between $25.67 and $30.47, with downside favored at a 77% probability unless resistance at $28.25 is cleared.
Bearish momentum dominates as oscillators flag selling and indecision
On the hourly chart, HIMS is trading below its MA-20 and MA-50, while remaining above its long-term MA-200. The Ichimoku Kijun sits at $28.25 and forms the nearest resistance zone. Today's session recorded a pronounced drop in price, with high volatility and a gap down at the open, closing near session lows. Momentum indicators confirm strong bearishness—MACD is on a sell signal, ADX also signals sell, and the Awesome Oscillator aligns with this bearish bias. RSI reads 43.92 and remains within sell territory. However, Stochastic RSI has flipped to a buy signal and the CCI is neutral, adding a layer of indecision. Bull/Bear Power highlights an oversold environment, indicating seller dominance, while the divergence between oscillators suggests underlying indecision in oversold conditions.
Downside favored as volatility persists within projected trading band
Over the next several sessions, HIMS is anticipated to move within the $25.67 to $30.47 range—a typical volatility band relative to current levels. Statistical outlook favors further downside, with a 77% probability of continued negative movement and only a 23% chance of a reversal higher. The most likely scenario calls for sideways trading inside this band. Should price overcome the immediate $28.25 resistance, a bullish setup could gain traction; otherwise, a breakdown below support may open the way for a move toward the lower edge of the projected range.
Previously it was reported that Hims & Hers faced persistent technical and legal pressures, with analysts highlighting downside risk amid class action lawsuits and ongoing restructuring costs. The latest technical evidence reinforces this cautious outlook, suggesting traders should monitor the $28.25 resistance and $25.67 support as potential inflection points in the upcoming sessions.






Latest Hims & Hers News





-
 Afghanistan
-
 Albania
-
 Algeria
-
 Angola
-
 Argentina
-
 Armenia
-
 Australia
-
 Austria
-
 Azerbaijan
-
 Bahamas
-
 Bahrain
-
 Bangladesh
-
 Belarus
-
 Belgium
-
 Bolivia
-
 Botswana
-
 Brazil
-
 Brunei
-
 Bulgaria
-
 Cambodia
-
 Cameroon
-
 Canada
-
 Chile
-
 China
-
 Colombia
-
 Congo
-
 Costa Rica
-
 Cote d'Ivoire
-
 Croatia
-
 Cuba
-
 Cyprus
-
 Czechia
-
 DR Congo
-
 Denmark
-
 Dominican Republic
-
 Ecuador
-
 Egypt
-
 El Salvador
-
 Estonia
-
 Eswatini
-
 Ethiopia
-
 Finland
-
 France
-
 Georgia
-
 Germany
-
 Ghana
-
 Greece
-
 Haiti
-
 Hong Kong
-
 Hungary
-
 India
-
 Indonesia
-
 Iran, Islamic republic
-
 Iraq
-
 Ireland
-
 Israel
-
 Italy
-
 Jamaica
-
 Japan
-
 Jordan
-
 Kazakhstan
-
 Kenya
-
 Korea
-
 Kuwait
-
 Kyrgyzstan
-
 Laos
-
 Latvia
-
 Lebanon
-
 Lesotho
-
 Libya
-
 Lithuania
-
 Luxembourg
-
 Madagascar
-
 Malaysia
-
 Malta
-
 Mauritius
-
 Mexico
-
 Moldova
-
 Mongolia
-
 Montenegro
-
 Morocco
-
 Mozambique
-
 Myanmar
-
 Namibia
-
 Nepal
-
 Netherlands
-
 New Zealand
-
 Nigeria
-
 North Macedonia
-
 Norway
-
 Oman
-
 Pakistan
-
 Palestine
-
 Panama
-
 Papua New Guinea
-
 Paraguay
-
 Peru
-
 Philippines
-
 Poland
-
 Portugal
-
 Puerto Rico
-
 Qatar
-
 Reunion
-
 Romania
-
 Rwanda
-
 Saudi Arabia
-
 Serbia
-
 Singapore
-
 Slovakia
-
 Slovenia
-
 Somalia
-
 South Africa
-
 Spain
-
 Sri Lanka
-
 Sweden
-
 Switzerland
-
 Syria
-
 Taiwan
-
 Tajikistan
-
 Tanzania
-
 Thailand
-
 Trinidad and Tobago
-
 Tunisia
-
 Turkey
-
 UAE
-
 Uganda
-
 Ukraine
-
 United Kingdom
-
United States
-
 Uruguay
-
 Uzbekistan
-
 Venezuela
-
 Vietnam
-
 Yemen
-
 Zambia
-
 Zimbabwe
- Forex
- Crypto












