

Manulife Financial stock slips while broader momentum remains positive despite weak short-term action

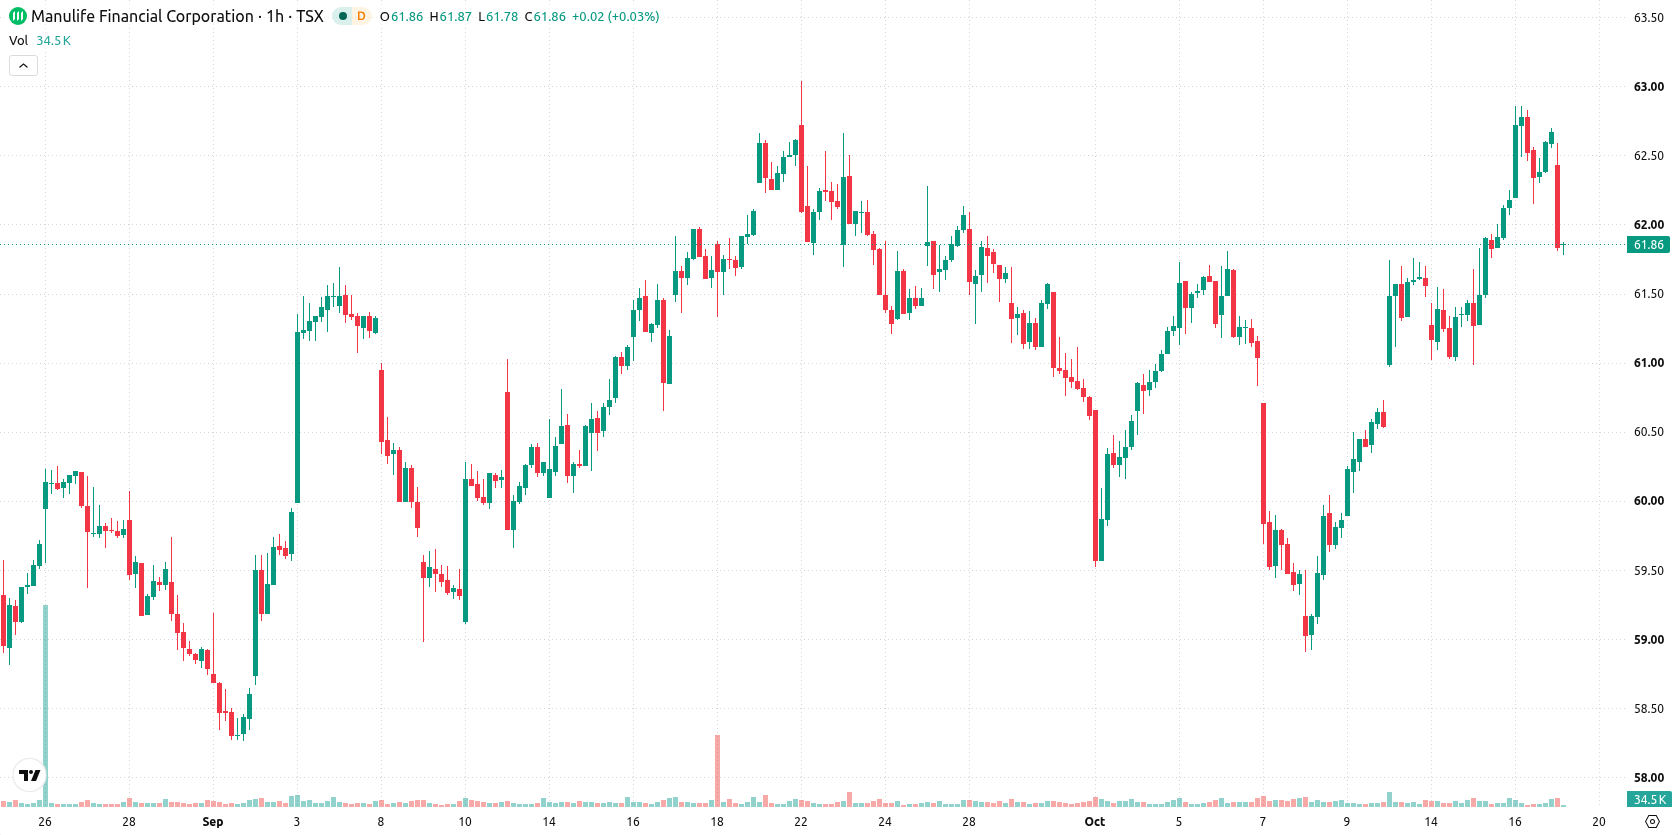
Manulife Financial (MFC) stock is trading at C$61.87 following a daily decline of 1.21%. The stock is positioned below its short-term moving average but remains above its medium- and long-term averages.
 63.39
63.59
Highlights
- Manulife Financial has introduced an enterprise AI platform and Advisor AI Assistant to improve underwriting accuracy and advisor productivity across its insurance business.
- These technology investments aim to digitize core processes, targeting operational efficiency, cost reduction, and stronger long-term profitability.
- Shares of Manulife slipped 1.21% to C$61.87, with short-term selling pressure, but technical momentum remains broadly positive and the trading range is expected to hold between C$61.04 to C$62.7.
Operational efficiency eyed as AI rollout meets ongoing selling pressure
Manulife Financial has launched an enterprise AI platform and a new Advisor AI Assistant, intended to enhance underwriting accuracy and boost advisor productivity across its insurance business, according to Simplywall. By digitizing core processes, these initiatives are expected to improve operational efficiency, potentially reducing costs and strengthening profitability over time. These technology investments indicate a strategic focus on innovation, though price action has remained under broader selling pressure.
Positive momentum diverges as short-term signals flag oversold risks
On the hourly timeframe, MFC is trading just below the MA-20 at C$61.87, while remaining above the MA-50 at C$61 and MA-200 at C$54.92. The Ichimoku Kijun at C$61.92 serves as immediate resistance. MACD signals strong buy momentum, and ADX reinforces a continued buy bias, highlighting robust underlying strength. RSI stands at 60.32 (Buy) and CCI also signals Buy, confirming positive momentum, whereas Stochastic RSI is in oversold territory. Bull/Bear Power confirms buyer dominance intraday. Awesome Oscillator is neutral and does not reinforce the ongoing trend. This mix of signals shows divergence between short-term oversold conditions and broader positive momentum.
Consolidation expected as upside probability rises within defined range
Over the next several days, the expected trading range lies between C$61.04 and C$62.7. The probability of an upward move is high at 73%. The baseline expectation is for price consolidation within this corridor, fluctuating between the immediate resistance and support levels. In a bullish scenario, a break above the Kijun resistance could trigger further gains, while a decline below support would increase the likelihood of additional downside pressure.
Earlier, analysts noted that Manulife Financial was demonstrating strong technical resilience and a generally bullish outlook supported by its ongoing digital transformation initiatives. The current mixed technical signals and increased adoption of AI-driven solutions add further complexity, making the C$61.04 to C$62.7 band a crucial zone for assessing potential breakout or pullback risks in the coming sessions.






Latest Manulife Financial News





-
 Afghanistan
-
 Albania
-
 Algeria
-
 Angola
-
 Argentina
-
 Armenia
-
 Australia
-
 Austria
-
 Azerbaijan
-
 Bahamas
-
 Bahrain
-
 Bangladesh
-
 Belarus
-
 Belgium
-
 Bolivia
-
 Botswana
-
 Brazil
-
 Brunei
-
 Bulgaria
-
 Cambodia
-
 Cameroon
-
 Canada
-
 Chile
-
 China
-
 Colombia
-
 Congo
-
 Costa Rica
-
 Cote d'Ivoire
-
 Croatia
-
 Cuba
-
 Cyprus
-
 Czechia
-
 DR Congo
-
 Denmark
-
 Dominican Republic
-
 Ecuador
-
 Egypt
-
 El Salvador
-
 Estonia
-
 Eswatini
-
 Ethiopia
-
 Finland
-
 France
-
 Georgia
-
 Germany
-
 Ghana
-
 Greece
-
 Haiti
-
 Hong Kong
-
 Hungary
-
 India
-
 Indonesia
-
 Iran, Islamic republic
-
 Iraq
-
 Ireland
-
 Israel
-
 Italy
-
 Jamaica
-
 Japan
-
 Jordan
-
 Kazakhstan
-
 Kenya
-
 Korea
-
 Kuwait
-
 Kyrgyzstan
-
 Laos
-
 Latvia
-
 Lebanon
-
 Lesotho
-
 Libya
-
 Lithuania
-
 Luxembourg
-
 Madagascar
-
 Malaysia
-
 Malta
-
 Mauritius
-
 Mexico
-
 Moldova
-
 Mongolia
-
 Montenegro
-
 Morocco
-
 Mozambique
-
 Myanmar
-
 Namibia
-
 Nepal
-
 Netherlands
-
 New Zealand
-
 Nigeria
-
 North Macedonia
-
 Norway
-
 Oman
-
 Pakistan
-
 Palestine
-
 Panama
-
 Papua New Guinea
-
 Paraguay
-
 Peru
-
 Philippines
-
 Poland
-
 Portugal
-
 Puerto Rico
-
 Qatar
-
 Reunion
-
 Romania
-
 Rwanda
-
 Saudi Arabia
-
 Serbia
-
 Singapore
-
 Slovakia
-
 Slovenia
-
 Somalia
-
 South Africa
-
 Spain
-
 Sri Lanka
-
 Sweden
-
 Switzerland
-
 Syria
-
 Taiwan
-
 Tajikistan
-
 Tanzania
-
 Thailand
-
 Trinidad and Tobago
-
 Tunisia
-
 Turkey
-
 UAE
-
 Uganda
-
 Ukraine
-
 United Kingdom
-
United States
-
 Uruguay
-
 Uzbekistan
-
 Venezuela
-
 Vietnam
-
 Yemen
-
 Zambia
-
 Zimbabwe
- Forex
- Crypto












