

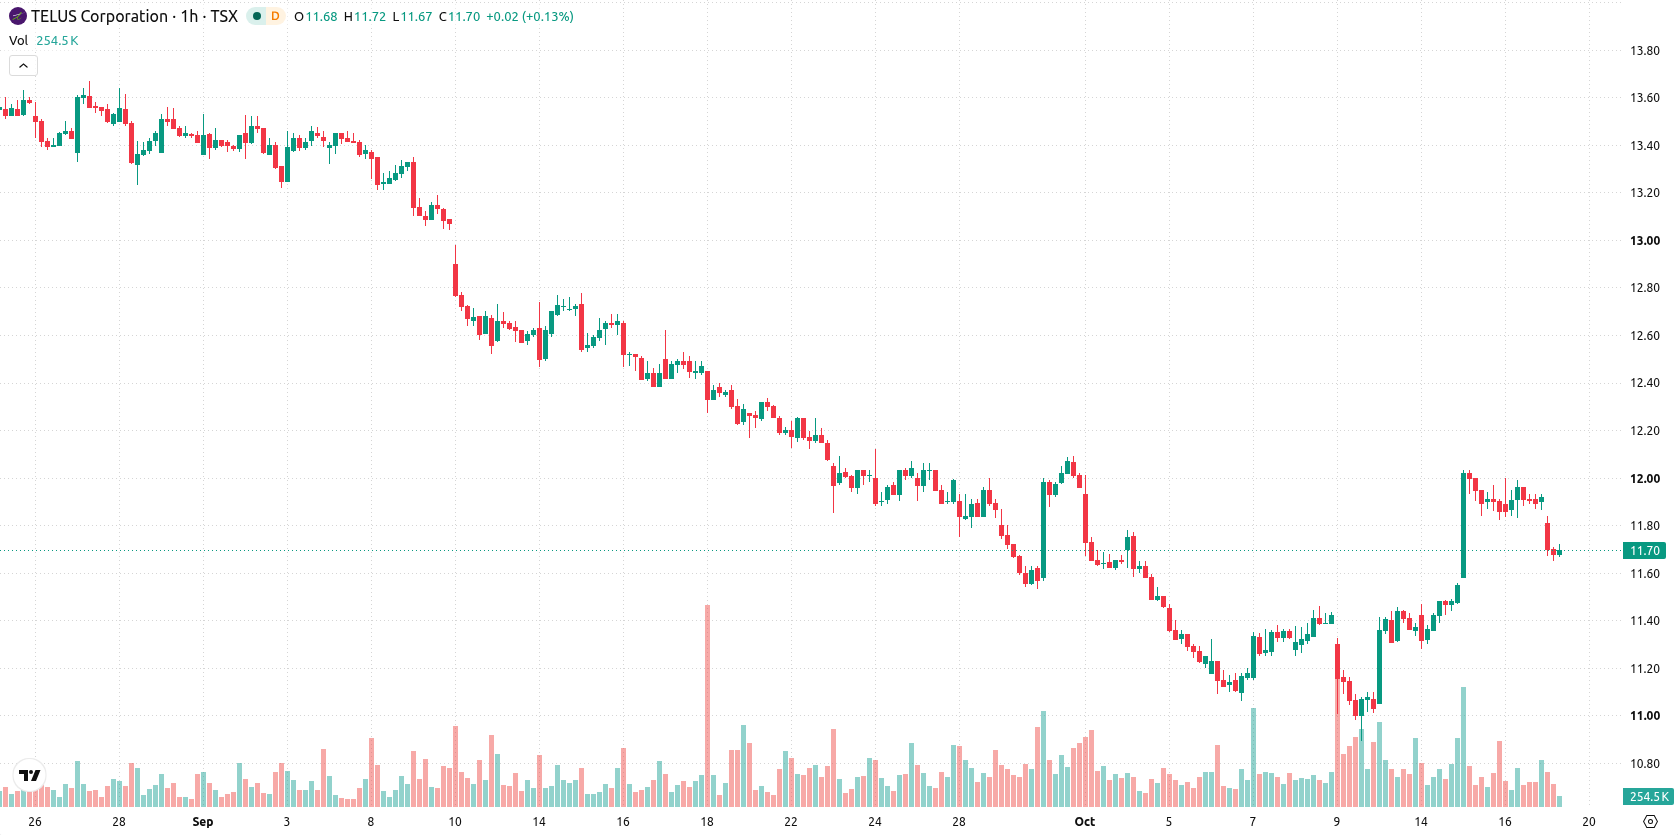
Will TELUS stock hold the C$11.66 support as downward price move continues?

TELUS (T) stock is trading at C$11.7 after a 1.85% decline today. The price sits below its short-term averages but above the medium-term average, indicating recent softness relative to its longer-term levels.
 12.41
12.41
Highlights
- TELUS has partnered with Parloa to add AI to its customer experience platform and completed a successful space-based connectivity integration test with AST SpaceMobile.
- TELUS is investing in innovation and new network capabilities, but the stock remains under broad selling pressure.
- TELUS stock trades below key long-term averages, with momentum indicators positive and price projected to consolidate between C$11.27 and C$12.13.
Innovation initiatives as new partnerships offset persistent selling pressure
TELUS has announced a partnership with Parloa to integrate AI solutions into its customer experience platform, a move that positions the company to leverage emerging technologies for improved support and operational streamlining. Additionally, TELUS and AST SpaceMobile completed their first space-based connectivity integration test, successfully linking TELUS infrastructure with AST SpaceMobile's satellite network to deliver direct voice, text, and broadband access between smartphones and space, as reported by Simplywall. These advancements reflect ongoing investment in innovation and network capabilities, though price action has remained under broader selling pressure.
Bullish momentum contrasts with mixed signals at technical support
On the H1 chart, T is trading below its MA-20 at C$11.78 and above its MA-50 at C$11.48, with the daily MA-200 well overhead at C$16.08. The Ichimoku Kijun level at C$11.66 is identified as immediate support for the current session. Momentum indicators show MACD signaling Strong Buy and ADX indicating Buy, with an RSI reading of 64.77. Stochastic RSI is in Oversold territory while CCI is Neutral, highlighting positive momentum but some short-term exhaustion. Bull/Bear Power indicates growing buyer dominance, whereas the Awesome Oscillator remains Neutral, showing limited trend confirmation.
Upside scenario favored as momentum and resistance levels converge
In the short term, T is expected to trade between C$11.27 and C$12.13 based on current volatility. There is a 58% probability of an upward break toward the C$12.13 resistance zone, should momentum carry through above technical barriers. While a downside scenario is less probable at 42%, a break under the C$11.66 support could prompt further declines toward the lower end of the forecasted volatility band. Price action will likely consolidate within this range absent a decisive technical catalyst.
Earlier, analysts noted that TELUS's dividend reduction and negative technical momentum pointed to a cautious outlook for the stock. The current analysis adds a new dimension with positive momentum signals offsetting recent price softness, making C$11.66 a critical support level to monitor for near-term downside risk.










-
 Afghanistan
-
 Albania
-
 Algeria
-
 Angola
-
 Argentina
-
 Armenia
-
 Australia
-
 Austria
-
 Azerbaijan
-
 Bahamas
-
 Bahrain
-
 Bangladesh
-
 Belarus
-
 Belgium
-
 Bolivia
-
 Botswana
-
 Brazil
-
 Brunei
-
 Bulgaria
-
 Cambodia
-
 Cameroon
-
 Canada
-
 Chile
-
 China
-
 Colombia
-
 Congo
-
 Costa Rica
-
 Cote d'Ivoire
-
 Croatia
-
 Cuba
-
 Cyprus
-
 Czechia
-
 DR Congo
-
 Denmark
-
 Dominican Republic
-
 Ecuador
-
 Egypt
-
 El Salvador
-
 Estonia
-
 Eswatini
-
 Ethiopia
-
 Finland
-
 France
-
 Georgia
-
 Germany
-
 Ghana
-
 Greece
-
 Haiti
-
 Hong Kong
-
 Hungary
-
 India
-
 Indonesia
-
 Iran, Islamic republic
-
 Iraq
-
 Ireland
-
 Israel
-
 Italy
-
 Jamaica
-
 Japan
-
 Jordan
-
 Kazakhstan
-
 Kenya
-
 Korea
-
 Kuwait
-
 Kyrgyzstan
-
 Laos
-
 Latvia
-
 Lebanon
-
 Lesotho
-
 Libya
-
 Lithuania
-
 Luxembourg
-
 Madagascar
-
 Malaysia
-
 Malta
-
 Mauritius
-
 Mexico
-
 Moldova
-
 Mongolia
-
 Montenegro
-
 Morocco
-
 Mozambique
-
 Myanmar
-
 Namibia
-
 Nepal
-
 Netherlands
-
 New Zealand
-
 Nigeria
-
 North Macedonia
-
 Norway
-
 Oman
-
 Pakistan
-
 Palestine
-
 Panama
-
 Papua New Guinea
-
 Paraguay
-
 Peru
-
 Philippines
-
 Poland
-
 Portugal
-
 Puerto Rico
-
 Qatar
-
 Reunion
-
 Romania
-
 Rwanda
-
 Saudi Arabia
-
 Serbia
-
 Singapore
-
 Slovakia
-
 Slovenia
-
 Somalia
-
 South Africa
-
 Spain
-
 Sri Lanka
-
 Sweden
-
 Switzerland
-
 Syria
-
 Taiwan
-
 Tajikistan
-
 Tanzania
-
 Thailand
-
 Trinidad and Tobago
-
 Tunisia
-
 Turkey
-
 UAE
-
 Uganda
-
 Ukraine
-
 United Kingdom
-
United States
-
 Uruguay
-
 Uzbekistan
-
 Venezuela
-
 Vietnam
-
 Yemen
-
 Zambia
-
 Zimbabwe
- Forex
- Crypto












