

Q3 earnings anticipation lifts Telus stock price as resistance test nears

Telus (T) stock is trading at C$12.35, gaining 2.32% on the day as it sits above its key short-term moving averages. This upward move keeps the share price positioned firmly above short-term trends, while remaining below longer-term averages.
 12.43
12.41
Highlights
- Telus stock faces increased trading activity and investor focus ahead of its Q3 2026 earnings release scheduled for November 6.
- Investors anticipate the upcoming earnings event could drive significant price discovery in the days before financial results are disclosed.
- Telus stock trades in an upward short-term bias with mixed technical signals and is projected to fluctuate between C$12.14 and C$12.56 over the next 2 to 3 days.
Investor activity climbs as Q3 earnings approach
Telus is approaching a scheduled catalyst with its Q3 2026 earnings release set for November 6, as reported by MarketBeat. This pending event heightens investor anticipation and often leads to increased trading activity as market participants position ahead of new financial disclosures. Market dynamics typically reflect these patterns in the days leading up to significant company announcements.
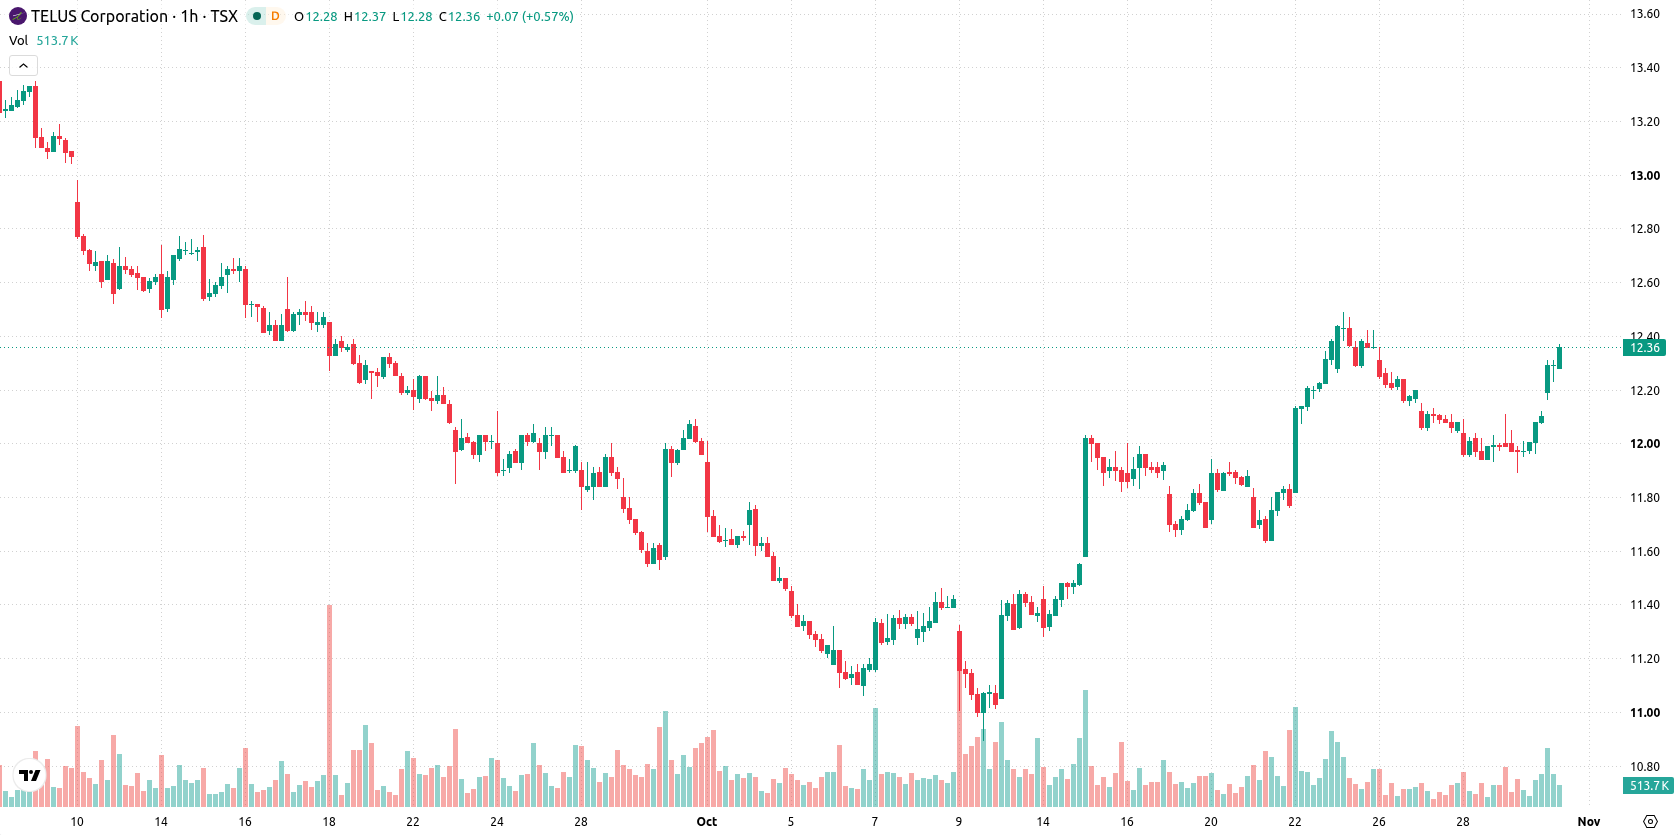
Mixed momentum as short-term buys meet resistance and exhaustion
On the technical front, T is trading above both its MA-20 at C$12.02 and MA-50 at C$12.09 on the hourly chart, while remaining below the longer-term MA-200 at C$15.79 on the daily chart. The Ichimoku Kijun at C$12.08 represents immediate support. Momentum signals remain mixed: MACD continues to signal Strong Sell, while ADX sits at Neutral, indicating an absence of clear trend strength. RSI is at 53.8 with a Buy signal, CCI also reads Buy, and Stochastic RSI is overbought, suggesting short-term exhaustion risk. Bull/Bear Power currently favors buyers, while the Awesome Oscillator is Neutral and does not provide a clear directional cue.
Bullish bias prevails as upside odds outweigh reversal risk
In the near term, T is forecast to trade between C$12.14 and C$12.56, based on typical volatility and current momentum. The probability of an upward move stands at 79%, suggesting a greater likelihood of strength continuing versus a reversal. The baseline scenario sees consolidation within this corridor, with a bullish outcome requiring a decisive break above resistance at C$12.56. Conversely, a bearish scenario would be triggered if the stock falls below immediate support at C$12.08.
Previously it was reported that Telus stock faced lingering technical and fundamental pressures following a major dividend cut, with mixed signals on the outlook. The current analysis adds a new dimension by highlighting a heightened probability of continued strength as the stock trades above short-term averages ahead of the Q3 2026 earnings release, making a decisive move above C$12.56 the key level to watch for confirmation of a sustained breakout.










-
 Afghanistan
-
 Albania
-
 Algeria
-
 Angola
-
 Argentina
-
 Armenia
-
 Australia
-
 Austria
-
 Azerbaijan
-
 Bahamas
-
 Bahrain
-
 Bangladesh
-
 Belarus
-
 Belgium
-
 Bolivia
-
 Botswana
-
 Brazil
-
 Brunei
-
 Bulgaria
-
 Cambodia
-
 Cameroon
-
 Canada
-
 Chile
-
 China
-
 Colombia
-
 Congo
-
 Costa Rica
-
 Cote d'Ivoire
-
 Croatia
-
 Cuba
-
 Cyprus
-
 Czechia
-
 DR Congo
-
 Denmark
-
 Dominican Republic
-
 Ecuador
-
 Egypt
-
 El Salvador
-
 Estonia
-
 Eswatini
-
 Ethiopia
-
 Finland
-
 France
-
 Georgia
-
 Germany
-
 Ghana
-
 Greece
-
 Haiti
-
 Hong Kong
-
 Hungary
-
 India
-
 Indonesia
-
 Iran, Islamic republic
-
 Iraq
-
 Ireland
-
 Israel
-
 Italy
-
 Jamaica
-
 Japan
-
 Jordan
-
 Kazakhstan
-
 Kenya
-
 Korea
-
 Kuwait
-
 Kyrgyzstan
-
 Laos
-
 Latvia
-
 Lebanon
-
 Lesotho
-
 Libya
-
 Lithuania
-
 Luxembourg
-
 Madagascar
-
 Malaysia
-
 Malta
-
 Mauritius
-
 Mexico
-
 Moldova
-
 Mongolia
-
 Montenegro
-
 Morocco
-
 Mozambique
-
 Myanmar
-
 Namibia
-
 Nepal
-
 Netherlands
-
 New Zealand
-
 Nigeria
-
 North Macedonia
-
 Norway
-
 Oman
-
 Pakistan
-
 Palestine
-
 Panama
-
 Papua New Guinea
-
 Paraguay
-
 Peru
-
 Philippines
-
 Poland
-
 Portugal
-
 Puerto Rico
-
 Qatar
-
 Reunion
-
 Romania
-
 Rwanda
-
 Saudi Arabia
-
 Serbia
-
 Singapore
-
 Slovakia
-
 Slovenia
-
 Somalia
-
 South Africa
-
 Spain
-
 Sri Lanka
-
 Sweden
-
 Switzerland
-
 Syria
-
 Taiwan
-
 Tajikistan
-
 Tanzania
-
 Thailand
-
 Trinidad and Tobago
-
 Tunisia
-
 Turkey
-
 UAE
-
 Uganda
-
 Ukraine
-
 United Kingdom
-
United States
-
 Uruguay
-
 Uzbekistan
-
 Venezuela
-
 Vietnam
-
 Yemen
-
 Zambia
-
 Zimbabwe
- Forex
- Crypto












