

Will NBIS recover above resistance amid continued volatility?

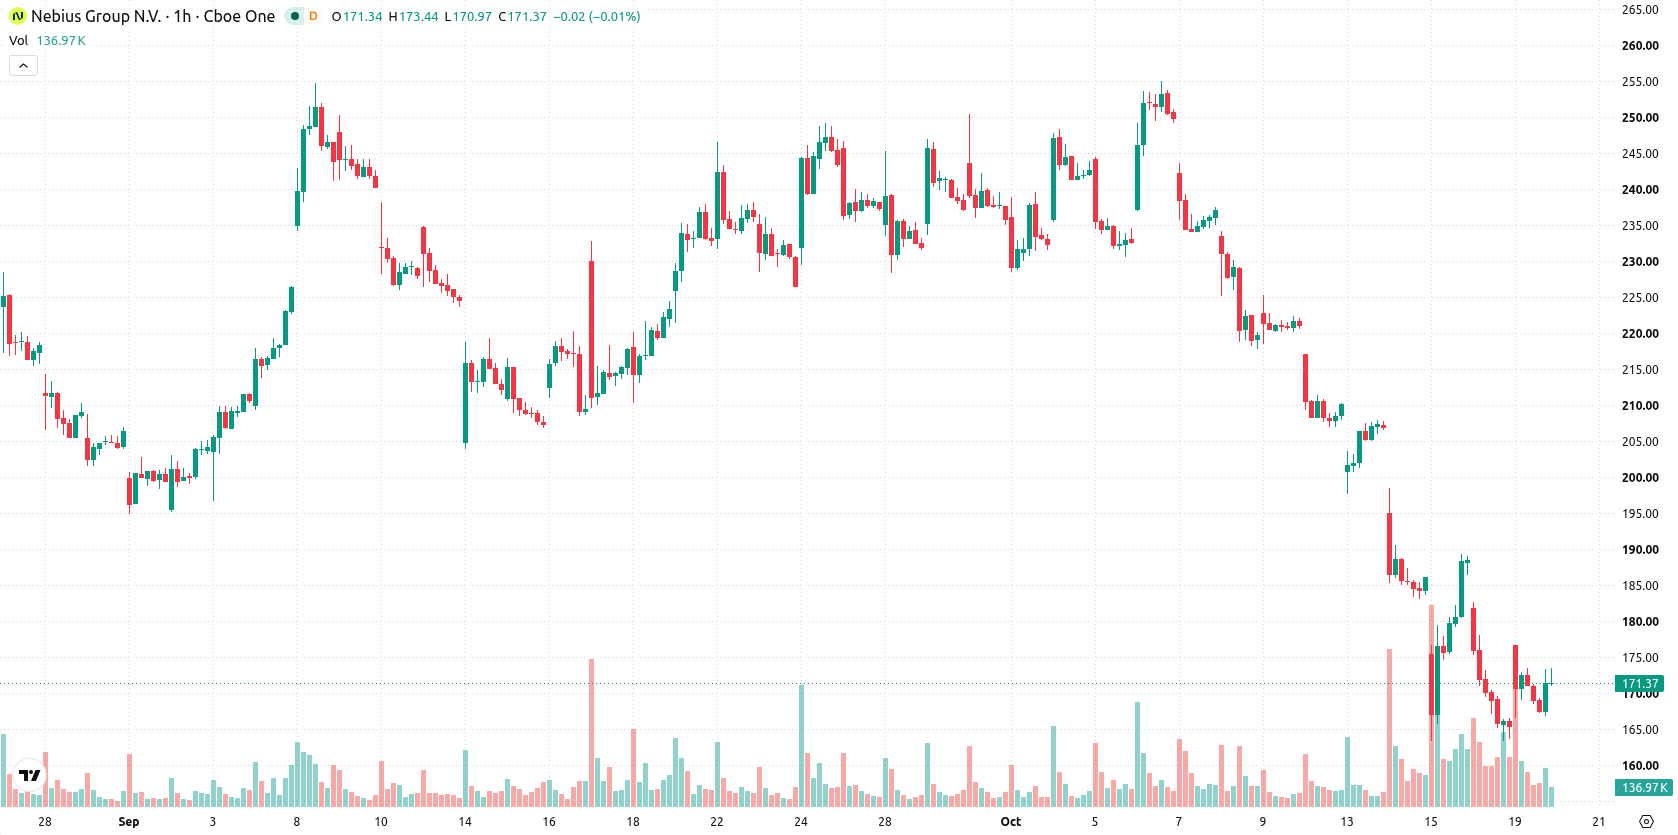
Nebius Group (NBIS) stock is trading at $171.73, posting a daily gain of 3.6%. The price is currently positioned below its key moving averages.
 161.42
182.45
Highlights
- Nebius Group reported 454% year-over-year revenue growth in the second quarter, supported by multi-billion dollars in deferred revenue.
- A new 12-year deal for 50 MW of AI data center capacity and the Inferize acquisition strengthen Nebius Group's AI cloud infrastructure and scalability.
- NBIS/USD trades below key moving averages with momentum and trend indicators signaling a 65% probability of further decline to the $151.85 to $191.61 range.
Record revenue jump and capacity deals drive bullish sentiment
Nebius Group’s reported 454% year-over-year revenue growth for the second quarter, along with multi-billion dollars in deferred revenue, signals a dramatic acceleration in demand for its AI cloud operations, according to StocksToTrade. This surge in booked business directly supports investor optimism around future cash flows and business expansion. The company’s recent 12-year agreement to secure 50 MW of AI data center capacity in the southeastern U.S. provides foundational infrastructure for long-term AI cloud growth, while the acquisition of Inferize on October 1, 2026, as reported by Finance Biggo, strengthens Nebius Group’s ability to scale large AI models and accelerates its technology roadmap.
Sell signals persist as volatility rises and indicators diverge
On the technical front, NBIS is trading below the 20- and 50-period moving averages on the H1 chart and remains under the 200-period MA at $174.05. The Ichimoku Kijun level at $176.95 acts as immediate resistance, while intraday volatility remains elevated following a gap of $10.84. MACD provides a strong sell signal and the ADX confirms a trending sell environment. However, both RSI and CCI indicate the asset is oversold, contrasted by a buy signal on the Stochastic RSI, highlighting mixed signals among oscillators. Bull/Bear Power underscores seller dominance intraday, while the Awesome Oscillator maintains a neutral reading.
Downside bias holds as range-bound scenario faces key breakout risks
In the short term, NBIS is likely to trend within a volatility band of $151.85 to $191.61 over the coming sessions. There is a higher probability—estimated at 65%—of further downside, with a 35% chance of recovery above immediate resistance. The baseline view anticipates NBIS trading sideways within its current range, with a bullish scenario contingent on a break above the $176.95 resistance or, conversely, confirmation of bearish momentum following a drop below support at $151.85.
Earlier, analysts noted that Nebius faces complex financing risks stemming from its substantial debt load and rapid capital investment, despite strong cash reserves and significant customer prepayments. The latest surge in revenue growth and new long-term infrastructure deals adds a new dimension to this outlook, making it essential for traders to monitor potential shifts in volatility and liquidity that could arise near technical levels such as $151.85 support or $176.95 resistance.






Latest Nebius Group N.V. News




-
 Afghanistan
-
 Albania
-
 Algeria
-
 Angola
-
 Argentina
-
 Armenia
-
 Australia
-
 Austria
-
 Azerbaijan
-
 Bahamas
-
 Bahrain
-
 Bangladesh
-
 Belarus
-
 Belgium
-
 Bolivia
-
 Botswana
-
 Brazil
-
 Brunei
-
 Bulgaria
-
 Cambodia
-
 Cameroon
-
 Canada
-
 Chile
-
 China
-
 Colombia
-
 Congo
-
 Costa Rica
-
 Cote d'Ivoire
-
 Croatia
-
 Cuba
-
 Cyprus
-
 Czechia
-
 DR Congo
-
 Denmark
-
 Dominican Republic
-
 Ecuador
-
 Egypt
-
 El Salvador
-
 Estonia
-
 Eswatini
-
 Ethiopia
-
 Finland
-
 France
-
 Georgia
-
 Germany
-
 Ghana
-
 Greece
-
 Haiti
-
 Hong Kong
-
 Hungary
-
 India
-
 Indonesia
-
 Iran, Islamic republic
-
 Iraq
-
 Ireland
-
 Israel
-
 Italy
-
 Jamaica
-
 Japan
-
 Jordan
-
 Kazakhstan
-
 Kenya
-
 Korea
-
 Kuwait
-
 Kyrgyzstan
-
 Laos
-
 Latvia
-
 Lebanon
-
 Lesotho
-
 Libya
-
 Lithuania
-
 Luxembourg
-
 Madagascar
-
 Malaysia
-
 Malta
-
 Mauritius
-
 Mexico
-
 Moldova
-
 Mongolia
-
 Montenegro
-
 Morocco
-
 Mozambique
-
 Myanmar
-
 Namibia
-
 Nepal
-
 Netherlands
-
 New Zealand
-
 Nigeria
-
 North Macedonia
-
 Norway
-
 Oman
-
 Pakistan
-
 Palestine
-
 Panama
-
 Papua New Guinea
-
 Paraguay
-
 Peru
-
 Philippines
-
 Poland
-
 Portugal
-
 Puerto Rico
-
 Qatar
-
 Reunion
-
 Romania
-
 Rwanda
-
 Saudi Arabia
-
 Serbia
-
 Singapore
-
 Slovakia
-
 Slovenia
-
 Somalia
-
 South Africa
-
 Spain
-
 Sri Lanka
-
 Sweden
-
 Switzerland
-
 Syria
-
 Taiwan
-
 Tajikistan
-
 Tanzania
-
 Thailand
-
 Trinidad and Tobago
-
 Tunisia
-
 Turkey
-
 UAE
-
 Uganda
-
 Ukraine
-
 United Kingdom
-
United States
-
 Uruguay
-
 Uzbekistan
-
 Venezuela
-
 Vietnam
-
 Yemen
-
 Zambia
-
 Zimbabwe
- Forex
- Crypto












