

McDonald's shares press up as Stochastic RSI enters overbought territory: weekly analysis

Shares of McDonald's Corporation (MCD) are trading near $245 as the recent rally slows after entering overbought territory. Technical indicators show mixed momentum, creating a tug-of-war between firm trend support and continued buying pressure as the market heads into a fresh week.
 259.67
Highlights
- Shares of McDonald's rose to $244.95 over the past seven days but continue to trade below longer-term moving averages.
- The current trend is upward with firm price action, yet technical indicators present mixed signals, including overbought momentum and a strong sell from MACD.
- The stock is expected to trade within $230.14 to $249.89 in the coming week, with a 33% probability of an increase and a 67% probability of a decrease.
Dividend hike and shifting investor flows cloud sentiment as pricing concerns rise
McDonald's is preparing to pay an increased quarterly dividend of $1.93 per share on December 15, 2026, marking a 4% raise and signaling continued shareholder focus, according to The Motley Fool. Meanwhile, several institutional investors significantly reduced their holdings in MCD during the third quarter, with notable decreases reported by Fairvoy Private Wealth LLC and Talbot Financial LLC, as highlighted by MarketBeat (source: MarketBeat). Morgan Stanley has flagged challenges to McDonald's pricing power as lower-income diners pull back, and the company is nearing 'Dividend King' status after nearly 50 consecutive years of dividend growth (sources: TheStreet, Yahoo Finance).
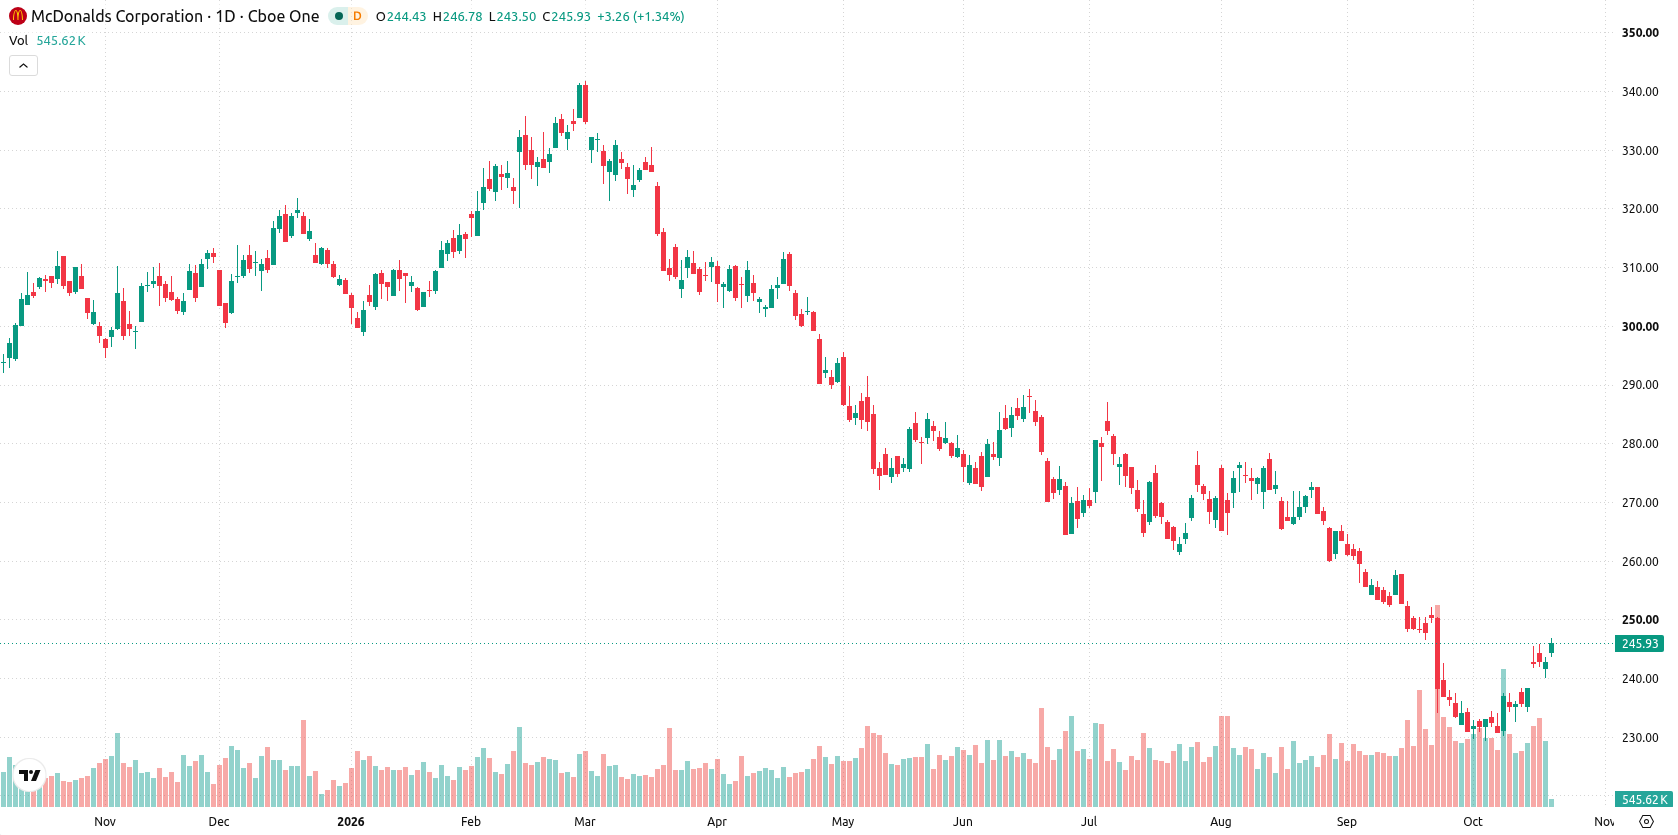
Sustained upside momentum narrows as overbought signals and resistance converge
The daily chart shows a sustained move higher with a firm trend, while volatility over the past week reached 4.72%. However, momentum signals are mixed, with Stochastic RSI deep in overbought territory at 97.84, but MACD signaling a strong sell. The stock is sitting on the Ichimoku Kijun support at $243.81 and is pressed against resistance at $245.35, narrowing its immediate trading range.
Range-bound action expected as breakout risks rise near key technical levels
Over the coming trading week, the expected range is $230.14 to $249.89, with a 33% probability of an increase and a 67% probability of a decrease. The base case calls for continued movement within this range, anchored between the Ichimoku Kijun and the recent high. A bullish break above $245.35 would open the way to test the upper band of the range, while a move below $243.81 would likely usher in further weakness toward the lower end near $230.14.
Previously it was reported that McDonald's faced persistent downward pressure as legal headwinds and franchisee dissent weighed on shares. The current analysis highlights a shift to mixed momentum following a technical rebound, with traders advised to monitor the $243.81–$245.35 zone as a pivotal range for near-term direction.






Latest McDonald’s News



-
 Afghanistan
-
 Albania
-
 Algeria
-
 Angola
-
 Argentina
-
 Armenia
-
 Australia
-
 Austria
-
 Azerbaijan
-
 Bahamas
-
 Bahrain
-
 Bangladesh
-
 Belarus
-
 Belgium
-
 Bolivia
-
 Botswana
-
 Brazil
-
 Brunei
-
 Bulgaria
-
 Cambodia
-
 Cameroon
-
 Canada
-
 Chile
-
 China
-
 Colombia
-
 Congo
-
 Costa Rica
-
 Cote d'Ivoire
-
 Croatia
-
 Cuba
-
 Cyprus
-
 Czechia
-
 DR Congo
-
 Denmark
-
 Dominican Republic
-
 Ecuador
-
 Egypt
-
 El Salvador
-
 Estonia
-
 Eswatini
-
 Ethiopia
-
 Finland
-
 France
-
 Georgia
-
 Germany
-
 Ghana
-
 Greece
-
 Haiti
-
 Hong Kong
-
 Hungary
-
 India
-
 Indonesia
-
 Iran, Islamic republic
-
 Iraq
-
 Ireland
-
 Israel
-
 Italy
-
 Jamaica
-
 Japan
-
 Jordan
-
 Kazakhstan
-
 Kenya
-
 Korea
-
 Kuwait
-
 Kyrgyzstan
-
 Laos
-
 Latvia
-
 Lebanon
-
 Lesotho
-
 Libya
-
 Lithuania
-
 Luxembourg
-
 Madagascar
-
 Malaysia
-
 Malta
-
 Mauritius
-
 Mexico
-
 Moldova
-
 Mongolia
-
 Montenegro
-
 Morocco
-
 Mozambique
-
 Myanmar
-
 Namibia
-
 Nepal
-
 Netherlands
-
 New Zealand
-
 Nigeria
-
 North Macedonia
-
 Norway
-
 Oman
-
 Pakistan
-
 Palestine
-
 Panama
-
 Papua New Guinea
-
 Paraguay
-
 Peru
-
 Philippines
-
 Poland
-
 Portugal
-
 Puerto Rico
-
 Qatar
-
 Reunion
-
 Romania
-
 Rwanda
-
 Saudi Arabia
-
 Serbia
-
 Singapore
-
 Slovakia
-
 Slovenia
-
 Somalia
-
 South Africa
-
 Spain
-
 Sri Lanka
-
 Sweden
-
 Switzerland
-
 Syria
-
 Taiwan
-
 Tajikistan
-
 Tanzania
-
 Thailand
-
 Trinidad and Tobago
-
 Tunisia
-
 Turkey
-
 UAE
-
 Uganda
-
 Ukraine
-
 United Kingdom
-
United States
-
 Uruguay
-
 Uzbekistan
-
 Venezuela
-
 Vietnam
-
 Yemen
-
 Zambia
-
 Zimbabwe
- Forex
- Crypto












