

AbbVie stock weekly forecast: Recent rally steadies as resistance looms at $291.36

Shares of AbbVie Inc. (ABBV) are trading near $287, holding steady after a quiet week where the recovery remained intact. As the rally shows signs of becoming stretched, investors are watching whether bullish momentum can persist into next week.
 297.20
300.31
Highlights
- Shares of AbbVie climbed to $287.48, advancing over the past 7 days and maintaining a strong uptrend.
- The price remains in a bullish long-term structure with indicators showing robust momentum, though overbought conditions are approaching.
- Key support is at $276.39, resistance at $291.36, with a projected trading range of $280.78 to $294.17 in the coming week.
Oncology and immunology updates boost sentiment as clinical results emerge
AbbVie is set to present new and updated data from its solid tumor research portfolio at the European Society for Medical Oncology Congress in Madrid, representing its largest presence to date, according to PR Newswire. The company also announced new clinical trial data showing its investigational Crohn’s disease therapy outperformed existing monotherapies in a Phase 2a study, and highlighted 20 new scientific abstracts from its inflammatory bowel disease portfolio at the United European Gastroenterology Week (sources: GuruFocus, GuruFocus). These developments reinforce ABBV’s ongoing focus on oncology and immunology research.
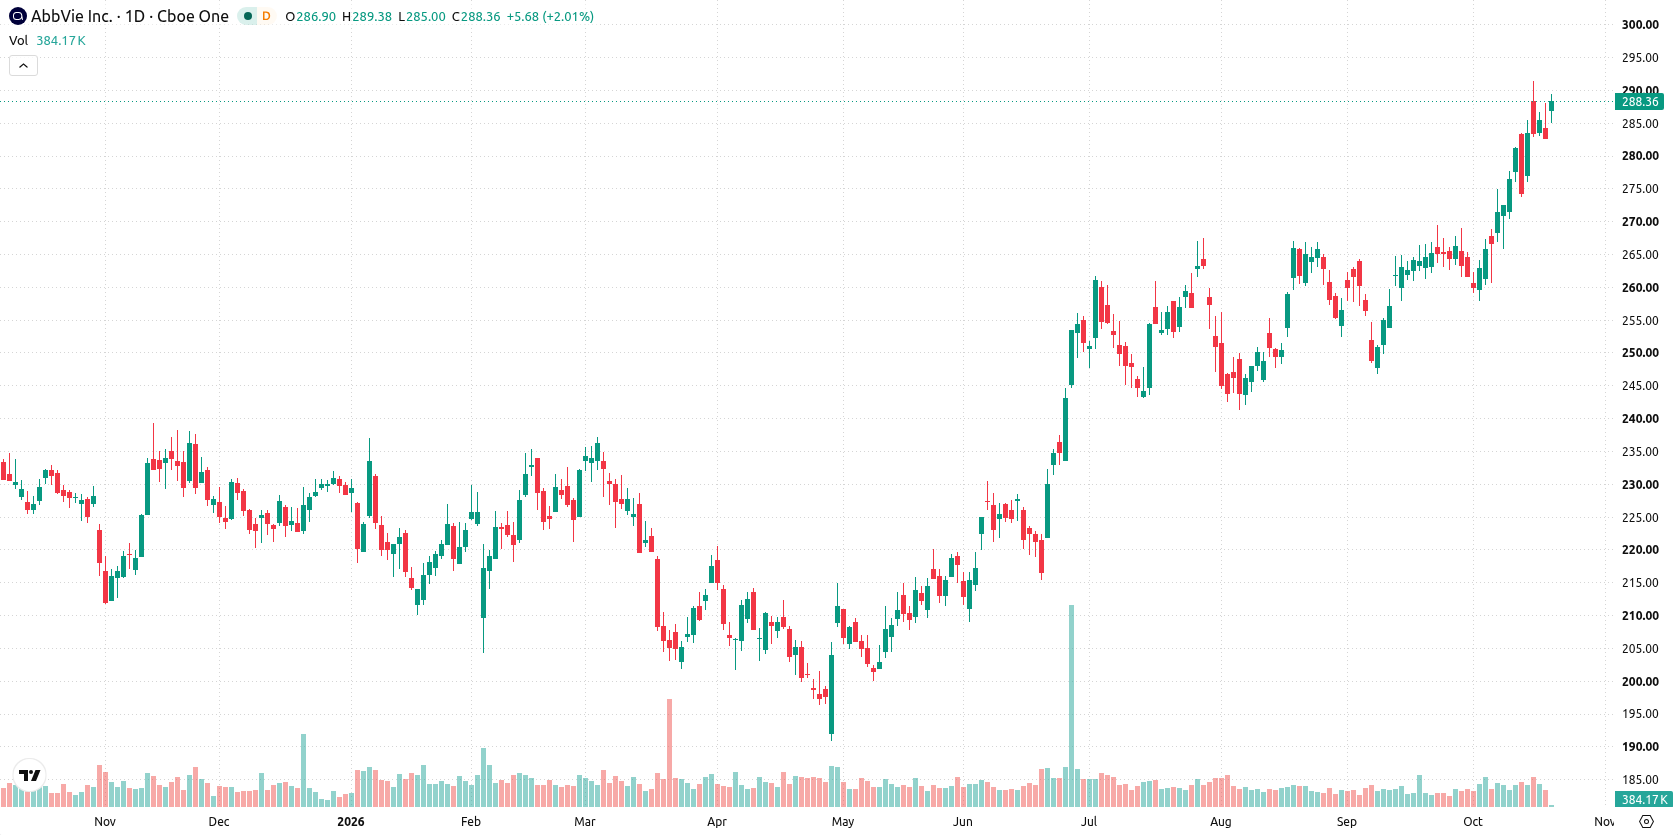
Uptrend persists as technical signals approach overbought thresholds
On the daily chart, AbbVie maintains a strong upward trend, with a sustained move higher and a firm trend character. Both the MACD and ADX signal continued buyer control, while the RSI is approaching overbought territory at 67.26, suggesting momentum remains robust but nearing stretched levels. Nearest support is at $276.39, with the Ichimoku Kijun at $274.58 also acting as a practical backstop, while resistance stands at $291.36. Volatility over the past 7 days has been moderate at 5.42%, which supports the ongoing trending move.
Breakout risk intensifies as bullish bias holds for the coming week
Over the coming trading week, the expected range is $280.78 to $294.17. There is a 75% probability of an increase and a 25% probability of a decrease. The base case is that the stock continues trending between current levels and resistance at $291.36. A break above $291.36 would open the way for further upside, while a move below support at $276.39 could shift momentum to the downside.
In a recent review, analysts highlighted AbbVie's sustained technical momentum and positive clinical results as key drivers underpinning a bullish outlook for the stock. With new data releases and major scientific presentations broadening AbbVie's research credentials, investors should monitor the $291.36 resistance level for signs of a potential breakout in the coming sessions.










-
 Afghanistan
-
 Albania
-
 Algeria
-
 Angola
-
 Argentina
-
 Armenia
-
 Australia
-
 Austria
-
 Azerbaijan
-
 Bahamas
-
 Bahrain
-
 Bangladesh
-
 Belarus
-
 Belgium
-
 Bolivia
-
 Botswana
-
 Brazil
-
 Brunei
-
 Bulgaria
-
 Cambodia
-
 Cameroon
-
 Canada
-
 Chile
-
 China
-
 Colombia
-
 Congo
-
 Costa Rica
-
 Cote d'Ivoire
-
 Croatia
-
 Cuba
-
 Cyprus
-
 Czechia
-
 DR Congo
-
 Denmark
-
 Dominican Republic
-
 Ecuador
-
 Egypt
-
 El Salvador
-
 Estonia
-
 Eswatini
-
 Ethiopia
-
 Finland
-
 France
-
 Georgia
-
 Germany
-
 Ghana
-
 Greece
-
 Haiti
-
 Hong Kong
-
 Hungary
-
 India
-
 Indonesia
-
 Iran, Islamic republic
-
 Iraq
-
 Ireland
-
 Israel
-
 Italy
-
 Jamaica
-
 Japan
-
 Jordan
-
 Kazakhstan
-
 Kenya
-
 Korea
-
 Kuwait
-
 Kyrgyzstan
-
 Laos
-
 Latvia
-
 Lebanon
-
 Lesotho
-
 Libya
-
 Lithuania
-
 Luxembourg
-
 Madagascar
-
 Malaysia
-
 Malta
-
 Mauritius
-
 Mexico
-
 Moldova
-
 Mongolia
-
 Montenegro
-
 Morocco
-
 Mozambique
-
 Myanmar
-
 Namibia
-
 Nepal
-
 Netherlands
-
 New Zealand
-
 Nigeria
-
 North Macedonia
-
 Norway
-
 Oman
-
 Pakistan
-
 Palestine
-
 Panama
-
 Papua New Guinea
-
 Paraguay
-
 Peru
-
 Philippines
-
 Poland
-
 Portugal
-
 Puerto Rico
-
 Qatar
-
 Reunion
-
 Romania
-
 Rwanda
-
 Saudi Arabia
-
 Serbia
-
 Singapore
-
 Slovakia
-
 Slovenia
-
 Somalia
-
 South Africa
-
 Spain
-
 Sri Lanka
-
 Sweden
-
 Switzerland
-
 Syria
-
 Taiwan
-
 Tajikistan
-
 Tanzania
-
 Thailand
-
 Trinidad and Tobago
-
 Tunisia
-
 Turkey
-
 UAE
-
 Uganda
-
 Ukraine
-
 United Kingdom
-
United States
-
 Uruguay
-
 Uzbekistan
-
 Venezuela
-
 Vietnam
-
 Yemen
-
 Zambia
-
 Zimbabwe
- Forex
- Crypto












