

BP stock extends downward move while weak momentum and oversold signals flag possible exhaustion

BP (BP) stock is trading at GBX606.7, down 1.57% on the day, with price currently positioned below its short- and medium-term moving averages but still holding above its longer-term level.
 635.40
638.00
Highlights
- BP met its net debt reduction target nearly a year ahead of plan, aided by this year's suspension of buybacks.
- The company now has greater balance sheet flexibility, with a capital allocation shift toward longer-term financial stability.
- Shares of BP ended at GBX606.7, with persistent seller momentum and an expected 2 to 3 day range of GBX590.4 to GBX616.45.
Balance sheet gains as buybacks pause shift priorities
BP has achieved its target of reducing net debt about a year ahead of schedule, an outcome supported by its decision to pause the buyback programme this year, according to Oedigital. Achieving this milestone signals a shift in capital allocation priorities and reflects an improvement in the company's balance sheet flexibility. While this supports BP's longer-term financial position, price action has remained under broader selling pressure.
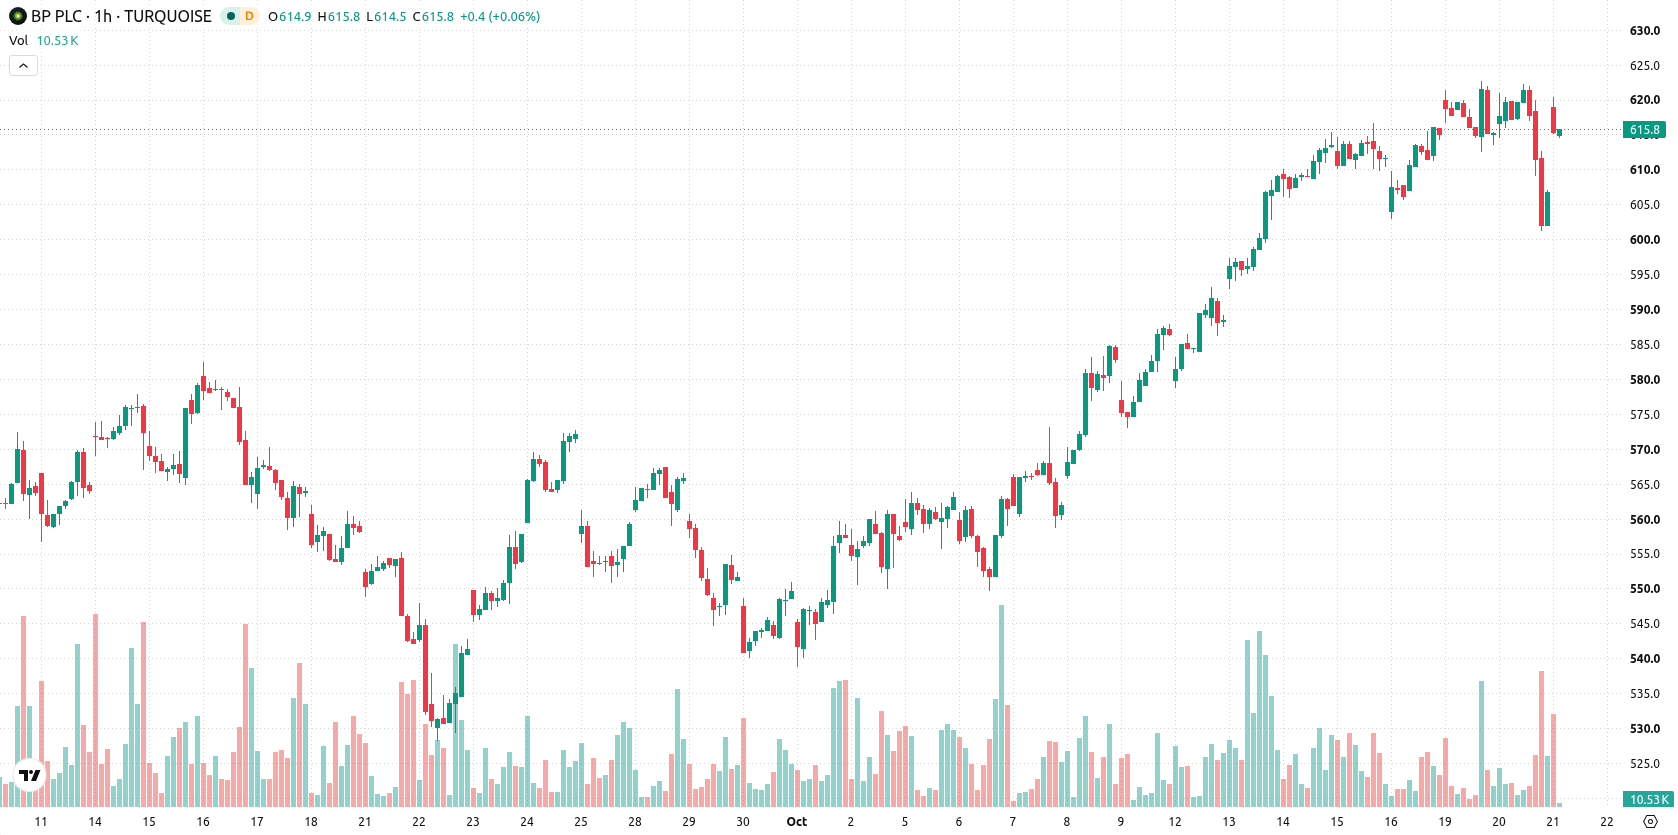
Bearish momentum deepens as indicators diverge at resistance
On the technical front, BP is trading below the MA-20 and MA-50 on the h1 chart, indicating near-term and intermediate resistance. Price remains above the long-term MA-200, suggesting the overarching trend structure is intact for now. The Ichimoku Kijun line at GBX611.8 serves as immediate resistance. Key support sits at GBX590.4, while additional resistance is near GBX616.45. Among momentum indicators, RSI reads 42.09 (Sell), and ADX also signals Sell, with MACD neutral; oversold conditions are indicated by both CCI and Bull/Bear Power, while Stoch RSI signals Strong Buy, highlighting divergence among oscillators. The Awesome Oscillator posts a Strong Sell and Bull/Bear Power continues to reflect intraday seller dominance, reinforcing a case for prevailing downward momentum but with signs of possible exhaustion.
Range-bound outlook as volatility favors mild downside bias
Over the next 2–3 days, the typical volatility band is expected between GBX590.4 and GBX616.45, with scenario probabilities tilted slightly towards continued downside (52%) versus upside (48%). The baseline case is for BP to hold within this range as price consolidates after recent weakness. If price sustains above the GBX611.8 resistance, a push toward the upper bound becomes more likely. Conversely, a move below GBX590.4 would potentially accelerate selling and expose further downside risk.
Earlier, analysts noted that BP’s stronger balance sheet following early net debt reduction and a pause in buybacks offered improved financial flexibility, with technicals favoring an overall constructive outlook. The current technical setup, however, points to sustained downside risk unless price reclaims the GBX611.8 resistance, making this a key level to watch for any potential shift in momentum over the coming days.










-
 Afghanistan
-
 Albania
-
 Algeria
-
 Angola
-
 Argentina
-
 Armenia
-
 Australia
-
 Austria
-
 Azerbaijan
-
 Bahamas
-
 Bahrain
-
 Bangladesh
-
 Belarus
-
 Belgium
-
 Bolivia
-
 Botswana
-
 Brazil
-
 Brunei
-
 Bulgaria
-
 Cambodia
-
 Cameroon
-
 Canada
-
 Chile
-
 China
-
 Colombia
-
 Congo
-
 Costa Rica
-
 Cote d'Ivoire
-
 Croatia
-
 Cuba
-
 Cyprus
-
 Czechia
-
 DR Congo
-
 Denmark
-
 Dominican Republic
-
 Ecuador
-
 Egypt
-
 El Salvador
-
 Estonia
-
 Eswatini
-
 Ethiopia
-
 Finland
-
 France
-
 Georgia
-
 Germany
-
 Ghana
-
 Greece
-
 Haiti
-
 Hong Kong
-
 Hungary
-
 India
-
 Indonesia
-
 Iran, Islamic republic
-
 Iraq
-
 Ireland
-
 Israel
-
 Italy
-
 Jamaica
-
 Japan
-
 Jordan
-
 Kazakhstan
-
 Kenya
-
 Korea
-
 Kuwait
-
 Kyrgyzstan
-
 Laos
-
 Latvia
-
 Lebanon
-
 Lesotho
-
 Libya
-
 Lithuania
-
 Luxembourg
-
 Madagascar
-
 Malaysia
-
 Malta
-
 Mauritius
-
 Mexico
-
 Moldova
-
 Mongolia
-
 Montenegro
-
 Morocco
-
 Mozambique
-
 Myanmar
-
 Namibia
-
 Nepal
-
 Netherlands
-
 New Zealand
-
 Nigeria
-
 North Macedonia
-
 Norway
-
 Oman
-
 Pakistan
-
 Palestine
-
 Panama
-
 Papua New Guinea
-
 Paraguay
-
 Peru
-
 Philippines
-
 Poland
-
 Portugal
-
 Puerto Rico
-
 Qatar
-
 Reunion
-
 Romania
-
 Rwanda
-
 Saudi Arabia
-
 Serbia
-
 Singapore
-
 Slovakia
-
 Slovenia
-
 Somalia
-
 South Africa
-
 Spain
-
 Sri Lanka
-
 Sweden
-
 Switzerland
-
 Syria
-
 Taiwan
-
 Tajikistan
-
 Tanzania
-
 Thailand
-
 Trinidad and Tobago
-
 Tunisia
-
 Turkey
-
 UAE
-
 Uganda
-
 Ukraine
-
 United Kingdom
-
United States
-
 Uruguay
-
 Uzbekistan
-
 Venezuela
-
 Vietnam
-
 Yemen
-
 Zambia
-
 Zimbabwe
- Forex
- Crypto












