

TSCO trades flat as mixed technical signals suggest ongoing tug-of-war between buyers and sellers

Tesco (TSCO) stock is trading at GBX537.00, slipping modestly today in a narrow band. The price is currently below its short-term average but maintains a position above intermediate and long-term moving averages.
 567.80
561.00
Highlights
- Tesco PLC executed a share buyback of 6,433,575 ordinary shares at 542.73 pence per share under its £950 million programme.
- The buyback reduces the outstanding ordinary shares to 6,252,764,364 and tightens the public float, supporting capital returns.
- Tesco stock is forecast to trade between GBX526.98 and GBX547.02 with mixed technical signals and moderate volatility intraday.
Share buyback tightens float and underpins medium-term sentiment
Tesco PLC executed a share buyback on October 20, 2026, acquiring 6,433,575 ordinary shares at an average price of 542.73 pence per share, as part of its ongoing £950 million programme, according to Investegate Co. This action reduces the outstanding ordinary shares to 6,252,764,364 and directly tightens the public float, reinforcing capital returns to shareholders. Such activity can affect supply-demand dynamics and may offer underlying support for the stock in the medium term.
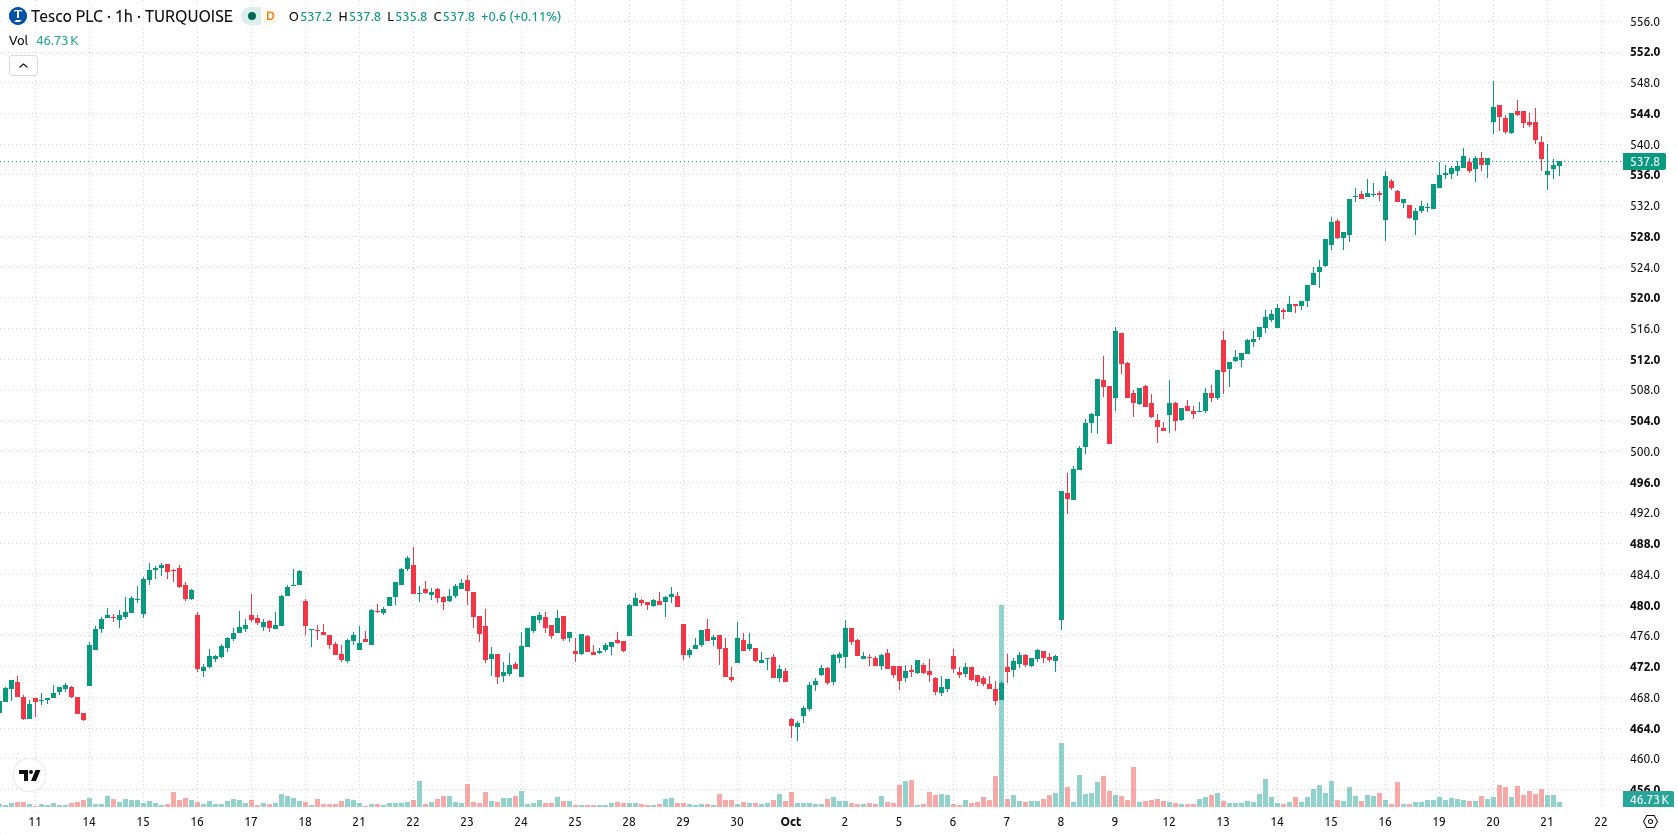
Technical signals mixed as resistance and support remain in play
On the H1 chart, TSCO is trading below the MA-20 at the short-term, while maintaining support above the MA-50. The price remains comfortably over the MA-200, confirming a resilient longer-term structure. The Ichimoku Kijun at GBX538.2 acts as immediate resistance. Among indicators, MACD delivers a strong buy signal, but ADX points to ongoing selling pressure. RSI and CCI are both in sell territory, whereas Stochastic RSI and Bull/Bear Power highlight oversold conditions. The Awesome Oscillator is neutral, giving no directional bias, with most signals overall reflecting mixed momentum and a tug-of-war between buyers and sellers.
Rangebound outlook with slight upside tilt amid key levels
Over the next 2–3 sessions, TSCO is likely to move within a typical volatility band between GBX526.98 and GBX547.02. The up probability is estimated at 57%, suggesting a slight tilt toward gains, with a 43% likelihood of a retracement lower. The baseline scenario expects continued sideways action within this established range. A break above the GBX538.2 Kijun resistance could point to a bullish extension, while a drop below the lower range support would open the door for further downside.
Earlier, analysts noted that Tesco’s ongoing share buyback initiative and supportive technical posture had established a constructive backdrop for the stock. The latest tranche and evolving momentum signals reinforce a cautiously positive scenario, with attention now turning to a potential move above the GBX538.2 Kijun resistance as a key indicator for near-term direction.






Latest Tesco News





-
 Afghanistan
-
 Albania
-
 Algeria
-
 Angola
-
 Argentina
-
 Armenia
-
 Australia
-
 Austria
-
 Azerbaijan
-
 Bahamas
-
 Bahrain
-
 Bangladesh
-
 Belarus
-
 Belgium
-
 Bolivia
-
 Botswana
-
 Brazil
-
 Brunei
-
 Bulgaria
-
 Cambodia
-
 Cameroon
-
 Canada
-
 Chile
-
 China
-
 Colombia
-
 Congo
-
 Costa Rica
-
 Cote d'Ivoire
-
 Croatia
-
 Cuba
-
 Cyprus
-
 Czechia
-
 DR Congo
-
 Denmark
-
 Dominican Republic
-
 Ecuador
-
 Egypt
-
 El Salvador
-
 Estonia
-
 Eswatini
-
 Ethiopia
-
 Finland
-
 France
-
 Georgia
-
 Germany
-
 Ghana
-
 Greece
-
 Haiti
-
 Hong Kong
-
 Hungary
-
 India
-
 Indonesia
-
 Iran, Islamic republic
-
 Iraq
-
 Ireland
-
 Israel
-
 Italy
-
 Jamaica
-
 Japan
-
 Jordan
-
 Kazakhstan
-
 Kenya
-
 Korea
-
 Kuwait
-
 Kyrgyzstan
-
 Laos
-
 Latvia
-
 Lebanon
-
 Lesotho
-
 Libya
-
 Lithuania
-
 Luxembourg
-
 Madagascar
-
 Malaysia
-
 Malta
-
 Mauritius
-
 Mexico
-
 Moldova
-
 Mongolia
-
 Montenegro
-
 Morocco
-
 Mozambique
-
 Myanmar
-
 Namibia
-
 Nepal
-
 Netherlands
-
 New Zealand
-
 Nigeria
-
 North Macedonia
-
 Norway
-
 Oman
-
 Pakistan
-
 Palestine
-
 Panama
-
 Papua New Guinea
-
 Paraguay
-
 Peru
-
 Philippines
-
 Poland
-
 Portugal
-
 Puerto Rico
-
 Qatar
-
 Reunion
-
 Romania
-
 Rwanda
-
 Saudi Arabia
-
 Serbia
-
 Singapore
-
 Slovakia
-
 Slovenia
-
 Somalia
-
 South Africa
-
 Spain
-
 Sri Lanka
-
 Sweden
-
 Switzerland
-
 Syria
-
 Taiwan
-
 Tajikistan
-
 Tanzania
-
 Thailand
-
 Trinidad and Tobago
-
 Tunisia
-
 Turkey
-
 UAE
-
 Uganda
-
 Ukraine
-
 United Kingdom
-
United States
-
 Uruguay
-
 Uzbekistan
-
 Venezuela
-
 Vietnam
-
 Yemen
-
 Zambia
-
 Zimbabwe
- Forex
- Crypto












