

Tesco stock outlook: Bullish momentum holds despite overbought signals

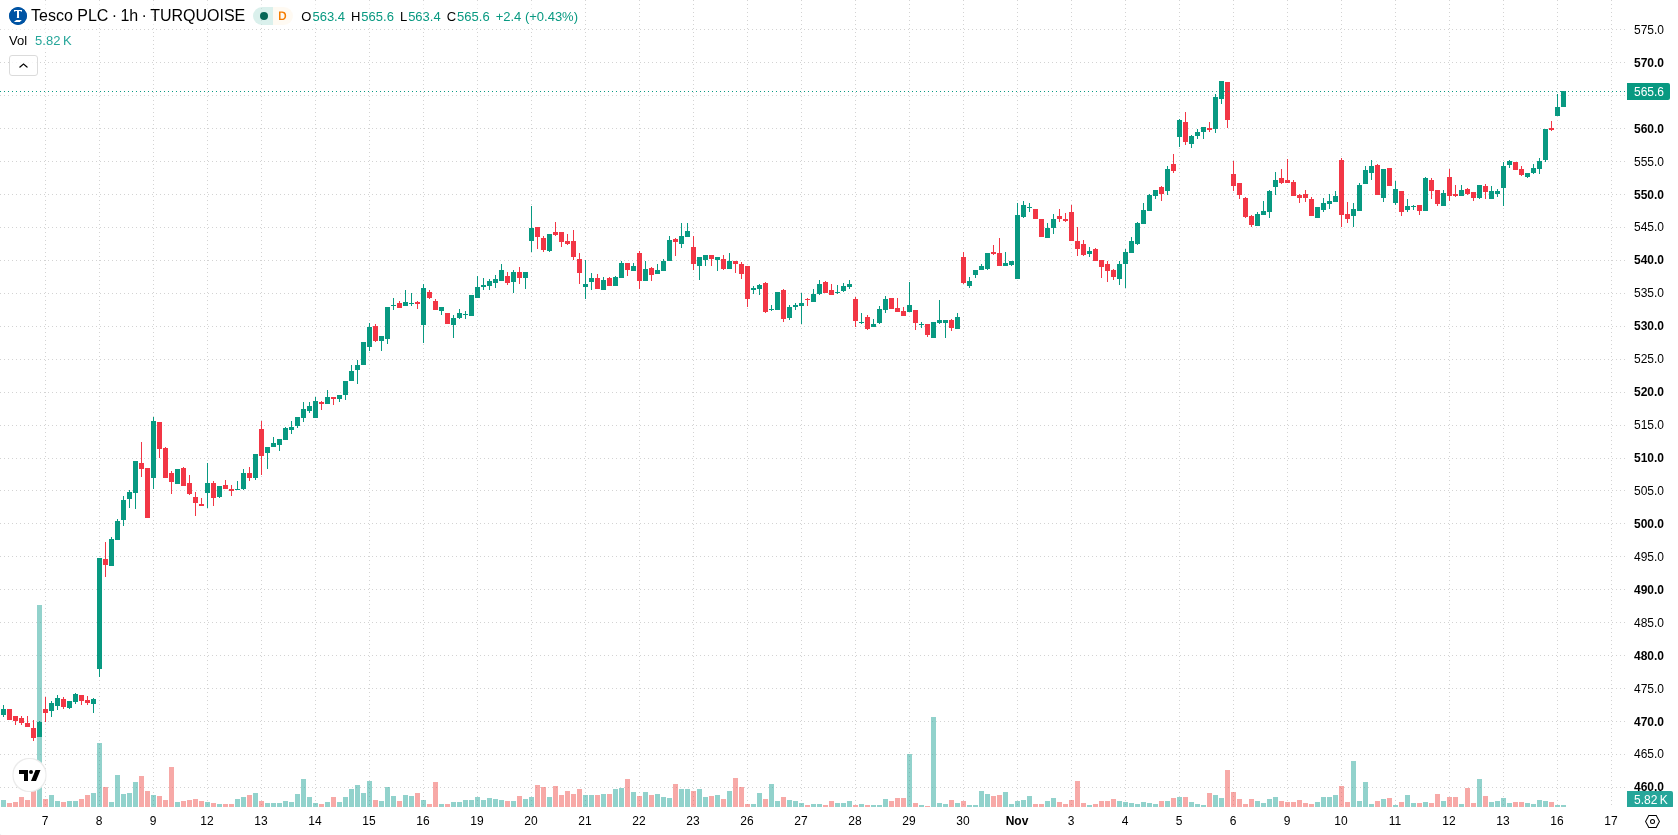
Tesco (TSCO) stock is trading at GBX566.4, marking a daily advance of 1.18%. Price action currently holds above its key moving averages, maintaining a solid bullish stance on both the intraday and daily timeframes.
 567.80
561.00
Highlights
- Tesco stock offers a 2.63% dividend yield with a payout ratio of 48.99%, appealing to income-focused investors.
- Steady cash flow generation and disciplined capital allocation support Tesco's ongoing commitment to its dividend policy.
- Tesco shares show pronounced bullish momentum, with technicals projecting a near-term range of GBX559.24 to GBX573.56 and only moderate risk of a short-term pullback.
Dividend reliability and cash flow strength attract income-driven investors
Tesco PLC is currently offering a dividend yield of 2.63%, with a payout ratio of 48.99%. This level of shareholder return highlights the company’s ability to generate reliable cash flows and maintain disciplined capital allocation, which helps attract income-seeking investors to TSCO shares. The commitment to sustaining dividends underpins positive sentiment, aligning with today’s upward move in the stock.
Strong momentum with overbought signals heightens correction risk
On the technical front, TSCO/GBX continues to close above the MA-20 (GBX553.26) and MA-50 (GBX551.25) on the H1 chart, while maintaining significant distance above the MA-200 (GBX479) on the daily chart. The Ichimoku Kijun level at GBX556 establishes immediate support. Momentum indicators are strong, as both MACD and ADX remain bullish. However, RSI, Stoch RSI, and CCI are all in overbought territory, indicating the possibility of a short-term correction or near-term overheating. Bull/Bear Power is elevated at 9.3, signifying clear intraday buying strength, and the Awesome Oscillator further confirms the ongoing uptrend. Despite cohesive trend indicators, the cluster of overbought oscillators signals caution for aggressive buyers in the near term.
Sideways consolidation likely unless volatility triggers breakout
Looking ahead, TSCO is expected to trade within a range of GBX559.24 to GBX573.56 over the next 2–3 sessions, a volatility band consistent with recent price action. The baseline scenario is for price to consolidate sideways within this corridor. A break above the upper bound would trigger a bullish continuation, while a move below support at GBX559.24 or a loss of the Kijun level at GBX556 could open the way for a deeper retracement, though such a move is considered to have very low probability at present.
Earlier, analysts noted that Tesco shares were demonstrating sustained bullish momentum supported by strong technical alignment and buyer dominance. The current analysis builds on this outlook by highlighting that, while the uptrend persists, traders should closely monitor for a potential short-term correction as overbought conditions emerge on several oscillators.











-
 Afghanistan
-
 Albania
-
 Algeria
-
 Angola
-
 Argentina
-
 Armenia
-
 Australia
-
 Austria
-
 Azerbaijan
-
 Bahamas
-
 Bahrain
-
 Bangladesh
-
 Belarus
-
 Belgium
-
 Bolivia
-
 Botswana
-
 Brazil
-
 Brunei
-
 Bulgaria
-
 Cambodia
-
 Cameroon
-
 Canada
-
 Chile
-
 China
-
 Colombia
-
 Congo
-
 Costa Rica
-
 Cote d'Ivoire
-
 Croatia
-
 Cuba
-
 Cyprus
-
 Czechia
-
 DR Congo
-
 Denmark
-
 Dominican Republic
-
 Ecuador
-
 Egypt
-
 El Salvador
-
 Estonia
-
 Eswatini
-
 Ethiopia
-
 Finland
-
 France
-
 Georgia
-
 Germany
-
 Ghana
-
 Greece
-
 Haiti
-
 Hong Kong
-
 Hungary
-
 India
-
 Indonesia
-
 Iran, Islamic republic
-
 Iraq
-
 Ireland
-
 Israel
-
 Italy
-
 Jamaica
-
 Japan
-
 Jordan
-
 Kazakhstan
-
 Kenya
-
 Korea
-
 Kuwait
-
 Kyrgyzstan
-
 Laos
-
 Latvia
-
 Lebanon
-
 Lesotho
-
 Libya
-
 Lithuania
-
 Luxembourg
-
 Madagascar
-
 Malaysia
-
 Malta
-
 Mauritius
-
 Mexico
-
 Moldova
-
 Mongolia
-
 Montenegro
-
 Morocco
-
 Mozambique
-
 Myanmar
-
 Namibia
-
 Nepal
-
 Netherlands
-
 New Zealand
-
 Nigeria
-
 North Macedonia
-
 Norway
-
 Oman
-
 Pakistan
-
 Palestine
-
 Panama
-
 Papua New Guinea
-
 Paraguay
-
 Peru
-
 Philippines
-
 Poland
-
 Portugal
-
 Puerto Rico
-
 Qatar
-
 Reunion
-
 Romania
-
 Rwanda
-
 Saudi Arabia
-
 Serbia
-
 Singapore
-
 Slovakia
-
 Slovenia
-
 Somalia
-
 South Africa
-
 Spain
-
 Sri Lanka
-
 Sweden
-
 Switzerland
-
 Syria
-
 Taiwan
-
 Tajikistan
-
 Tanzania
-
 Thailand
-
 Trinidad and Tobago
-
 Tunisia
-
 Turkey
-
 UAE
-
 Uganda
-
 Ukraine
-
 United Kingdom
-
United States
-
 Uruguay
-
 Uzbekistan
-
 Venezuela
-
 Vietnam
-
 Yemen
-
 Zambia
-
 Zimbabwe
- Forex
- Crypto












