

Apple stock consolidates amid diverging short-term technical signals

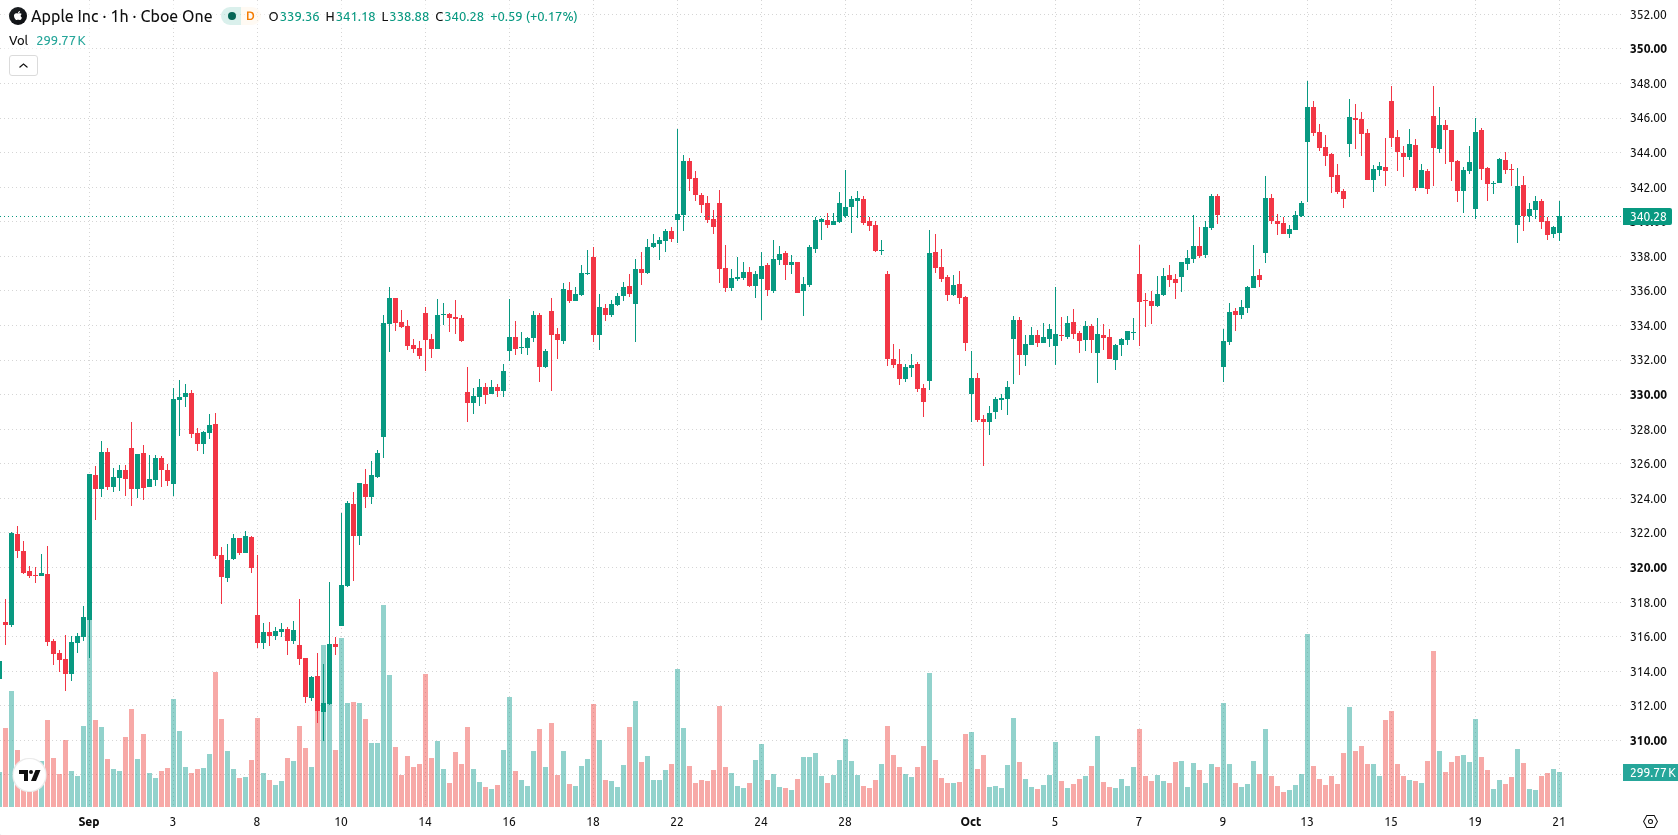
Apple Inc. (AAPL) stock is trading at $339.58 after a negligible change on the day, moving in a narrow range. The price is sitting below its key short- and medium-term moving averages, while remaining above its long-term support.
 347.18
351.53
Highlights
- ETFs added $356.3 million in Apple shares on October 19, expanding institutional participation and widening the investor base.
- The UK's competition authority proposes that Apple allow rival digital wallets to access iPhone contactless payments at reduced fees.
- Apple stock trades below short- and medium-term moving averages with mixed momentum signals and a projected $335.87 to $343.29 range.
ETF inflows and regulatory scrutiny shape demand stability and revenue risk
ETF activity saw $356.3 million in Apple shares added on October 19, as reported by Yahoo Finance, reflecting broad institutional engagement that adds support through expanded fund holdings. This ongoing accumulation by ETFs increases stability in the stock by widening the investor base and offering a reliable demand floor. Meanwhile, the UK's Competition and Markets Authority has proposed that Apple open its iPhone contactless payments to competing digital wallets at lower fees, according to Business Standard, which could introduce longer-term risks for service revenue and competitive dynamics.
Diverging technical signals as price tests resistance and mixed momentum
AAPL/USD is trading below the MA-20 at $342.43 and MA-50 at $342.69 on the H1 timeframe, with long-term support from the daily MA-200 at $293.16. The Ichimoku Kijun line at $343.26 serves as immediate resistance. The next key support is at $335.87, while resistance is set at $343.29. MACD signals a downside bias, ADX remains neutral, RSI is in sell territory, CCI is oversold, Stochastic RSI shows a strong buy, Bull/Bear Power signals sellers' dominance, and Awesome Oscillator confirms the current sell trend. These technical indicators present a mixed and diverging short-term outlook.
Greater downside probability as consolidation guides near-term outlook
For the coming 2–3 trading days, the expected price corridor is $335.87 to $343.29, consistent with typical volatility at current levels. Model scenarios suggest a 43% probability of an upward move and 57% for a decline, implying a greater likelihood of further weakness in the near term. The baseline scenario is for AAPL/USD to continue consolidating within this range. A clear break above $343.26 resistance may trigger additional upside, while a drop below $335.87 support would expose the stock to fresh downside risk.
Earlier, analysts noted that Apple's outlook was stable but subject to evolving sector dynamics and regulatory developments, with recent survey checks indicating a continued neutral stance. The latest trading data and technical signals reinforce a cautious view, with a current focus on whether AAPL can hold above the $335.87 support level or if a breakdown may expose the stock to renewed downside risk.






Latest Apple News





-
 Afghanistan
-
 Albania
-
 Algeria
-
 Angola
-
 Argentina
-
 Armenia
-
 Australia
-
 Austria
-
 Azerbaijan
-
 Bahamas
-
 Bahrain
-
 Bangladesh
-
 Belarus
-
 Belgium
-
 Bolivia
-
 Botswana
-
 Brazil
-
 Brunei
-
 Bulgaria
-
 Cambodia
-
 Cameroon
-
 Canada
-
 Chile
-
 China
-
 Colombia
-
 Congo
-
 Costa Rica
-
 Cote d'Ivoire
-
 Croatia
-
 Cuba
-
 Cyprus
-
 Czechia
-
 DR Congo
-
 Denmark
-
 Dominican Republic
-
 Ecuador
-
 Egypt
-
 El Salvador
-
 Estonia
-
 Eswatini
-
 Ethiopia
-
 Finland
-
 France
-
 Georgia
-
 Germany
-
 Ghana
-
 Greece
-
 Haiti
-
 Hong Kong
-
 Hungary
-
 India
-
 Indonesia
-
 Iran, Islamic republic
-
 Iraq
-
 Ireland
-
 Israel
-
 Italy
-
 Jamaica
-
 Japan
-
 Jordan
-
 Kazakhstan
-
 Kenya
-
 Korea
-
 Kuwait
-
 Kyrgyzstan
-
 Laos
-
 Latvia
-
 Lebanon
-
 Lesotho
-
 Libya
-
 Lithuania
-
 Luxembourg
-
 Madagascar
-
 Malaysia
-
 Malta
-
 Mauritius
-
 Mexico
-
 Moldova
-
 Mongolia
-
 Montenegro
-
 Morocco
-
 Mozambique
-
 Myanmar
-
 Namibia
-
 Nepal
-
 Netherlands
-
 New Zealand
-
 Nigeria
-
 North Macedonia
-
 Norway
-
 Oman
-
 Pakistan
-
 Palestine
-
 Panama
-
 Papua New Guinea
-
 Paraguay
-
 Peru
-
 Philippines
-
 Poland
-
 Portugal
-
 Puerto Rico
-
 Qatar
-
 Reunion
-
 Romania
-
 Rwanda
-
 Saudi Arabia
-
 Serbia
-
 Singapore
-
 Slovakia
-
 Slovenia
-
 Somalia
-
 South Africa
-
 Spain
-
 Sri Lanka
-
 Sweden
-
 Switzerland
-
 Syria
-
 Taiwan
-
 Tajikistan
-
 Tanzania
-
 Thailand
-
 Trinidad and Tobago
-
 Tunisia
-
 Turkey
-
 UAE
-
 Uganda
-
 Ukraine
-
 United Kingdom
-
United States
-
 Uruguay
-
 Uzbekistan
-
 Venezuela
-
 Vietnam
-
 Yemen
-
 Zambia
-
 Zimbabwe
- Forex
- Crypto












