

American Airlines earns top valuation grade: AAL gains momentum

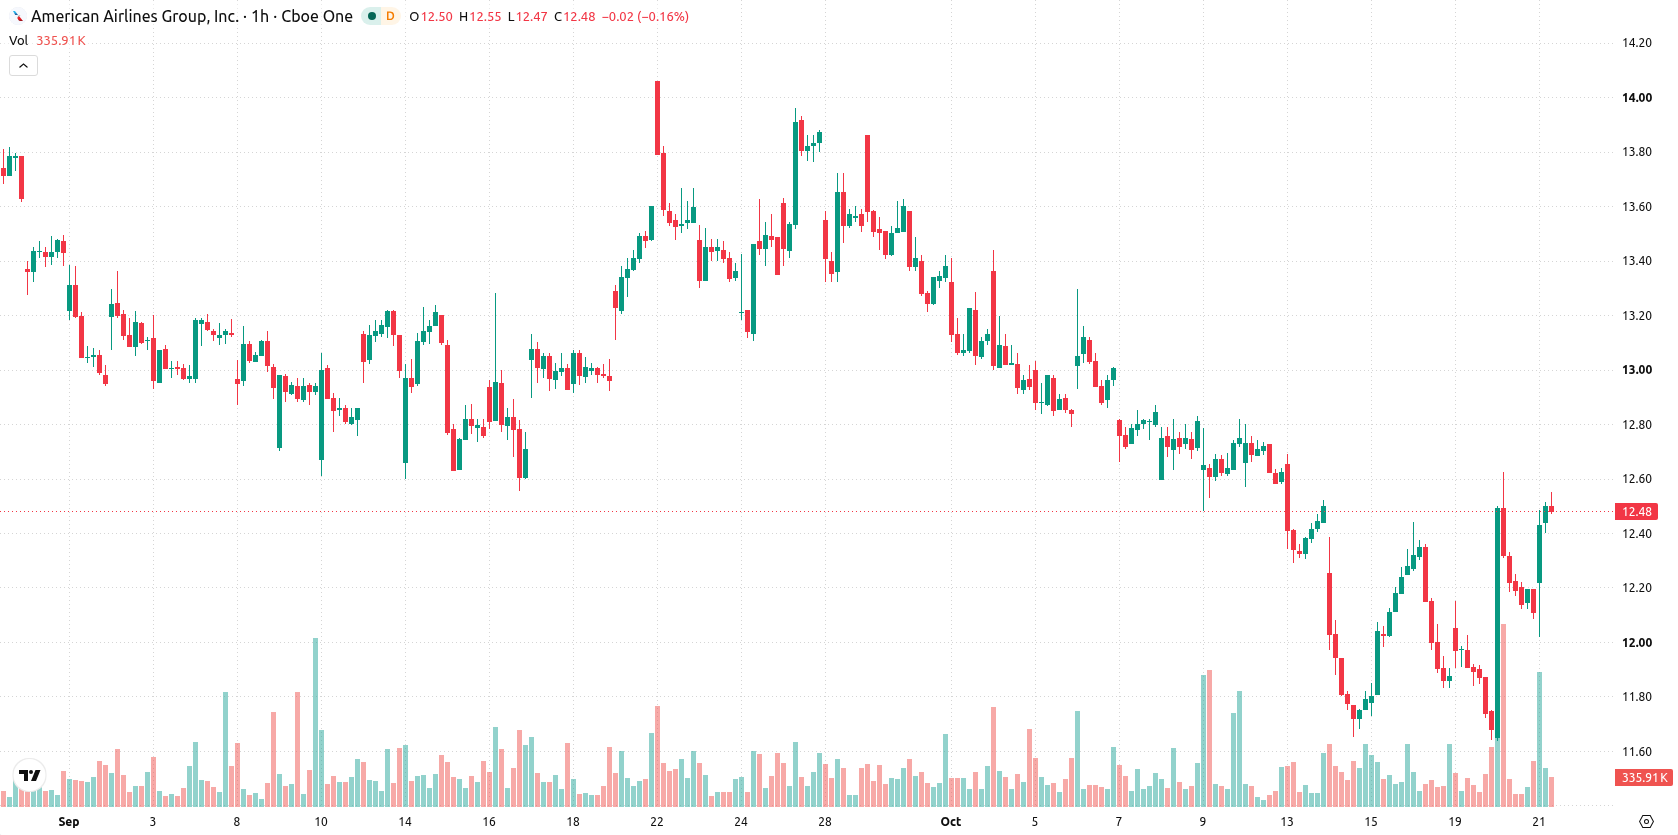
American Airlines (AAL) stock is trading at $12.51, up 3.32% for the day in a session marked by heightened volatility. The stock currently sits above its short- and medium-term moving averages, indicating strength over recent periods.
 12.84
13.52
Highlights
- American Airlines stock draws significant trading flows ahead of its scheduled third-quarter 2026 earnings announcement on October 22, 2026.
- The company earned a top valuation grade among industrial peers during the current earnings season.
- Shares trade at $12.51, up 3.32% with bullish intraday momentum, expected to consolidate between $11.76 and $12.96.
Investor positioning intensifies as earnings report anticipations build
Investor attention remains centered on American Airlines' scheduled third-quarter 2026 earnings release before the market opens on October 22, 2026, a confirmed event that drives heightened positioning and trading activity ahead of anticipated results, according to Yahoo Finance. This upcoming report has spurred investor expectations for updated insights into the company’s financial health, providing a focal point for trading flows. Adding to the constructive sentiment, American Airlines earned a top valuation grade among industrials during the current earnings season, as highlighted by Gurufocus, which may further support confidence as investors respond to new disclosures.
Bullish momentum and overbought signals as technical ceilings persist
AAL/USD is trading above the MA-20 and MA-50, but remains below the MA-200 level at $13.66. The Ichimoku Kijun sits at $12.14 and serves as immediate support. Momentum indicators show intraday bullishness: MACD and ADX both signal upward momentum, while RSI stands at 61.51, with Stochastic RSI and CCI both signaling overbought conditions. Bull/Bear Power confirms buyer dominance, and the Awesome Oscillator supports prevailing upside momentum, although elevated oscillator readings caution against further aggressive buying in the immediate term.
Consolidation favored amid upside bias and support-defined risks
In the short-term, AAL is expected to trade within the $11.76 to $12.96 range, reflecting a typical volatility band relative to current levels. There is a 75% probability of continued upside movement, while a downward move is less likely at 25%. The baseline scenario calls for consolidation within this range; a bullish breakout could drive an extension of the rally, while a decisive drop below immediate support near the Ichimoku Kijun would increase the risk of testing lower levels.
Earlier, analysts noted that American Airlines stock faced mixed momentum and heightened volatility, with expectations for largely rangebound trading and cautious monitoring of key technical levels. The latest positioning before the upcoming earnings release, reinforced by top industry valuations and sustained bullish momentum, highlights the importance of tracking price action near the Ichimoku Kijun support as a gauge for further potential upside or renewed downside risk.






Latest American Airlines News





-
 Afghanistan
-
 Albania
-
 Algeria
-
 Angola
-
 Argentina
-
 Armenia
-
 Australia
-
 Austria
-
 Azerbaijan
-
 Bahamas
-
 Bahrain
-
 Bangladesh
-
 Belarus
-
 Belgium
-
 Bolivia
-
 Botswana
-
 Brazil
-
 Brunei
-
 Bulgaria
-
 Cambodia
-
 Cameroon
-
 Canada
-
 Chile
-
 China
-
 Colombia
-
 Congo
-
 Costa Rica
-
 Cote d'Ivoire
-
 Croatia
-
 Cuba
-
 Cyprus
-
 Czechia
-
 DR Congo
-
 Denmark
-
 Dominican Republic
-
 Ecuador
-
 Egypt
-
 El Salvador
-
 Estonia
-
 Eswatini
-
 Ethiopia
-
 Finland
-
 France
-
 Georgia
-
 Germany
-
 Ghana
-
 Greece
-
 Haiti
-
 Hong Kong
-
 Hungary
-
 India
-
 Indonesia
-
 Iran, Islamic republic
-
 Iraq
-
 Ireland
-
 Israel
-
 Italy
-
 Jamaica
-
 Japan
-
 Jordan
-
 Kazakhstan
-
 Kenya
-
 Korea
-
 Kuwait
-
 Kyrgyzstan
-
 Laos
-
 Latvia
-
 Lebanon
-
 Lesotho
-
 Libya
-
 Lithuania
-
 Luxembourg
-
 Madagascar
-
 Malaysia
-
 Malta
-
 Mauritius
-
 Mexico
-
 Moldova
-
 Mongolia
-
 Montenegro
-
 Morocco
-
 Mozambique
-
 Myanmar
-
 Namibia
-
 Nepal
-
 Netherlands
-
 New Zealand
-
 Nigeria
-
 North Macedonia
-
 Norway
-
 Oman
-
 Pakistan
-
 Palestine
-
 Panama
-
 Papua New Guinea
-
 Paraguay
-
 Peru
-
 Philippines
-
 Poland
-
 Portugal
-
 Puerto Rico
-
 Qatar
-
 Reunion
-
 Romania
-
 Rwanda
-
 Saudi Arabia
-
 Serbia
-
 Singapore
-
 Slovakia
-
 Slovenia
-
 Somalia
-
 South Africa
-
 Spain
-
 Sri Lanka
-
 Sweden
-
 Switzerland
-
 Syria
-
 Taiwan
-
 Tajikistan
-
 Tanzania
-
 Thailand
-
 Trinidad and Tobago
-
 Tunisia
-
 Turkey
-
 UAE
-
 Uganda
-
 Ukraine
-
 United Kingdom
-
United States
-
 Uruguay
-
 Uzbekistan
-
 Venezuela
-
 Vietnam
-
 Yemen
-
 Zambia
-
 Zimbabwe
- Forex
- Crypto












