

AMD shares technical analysis: Reversal setup in play as oversold RSI emerges

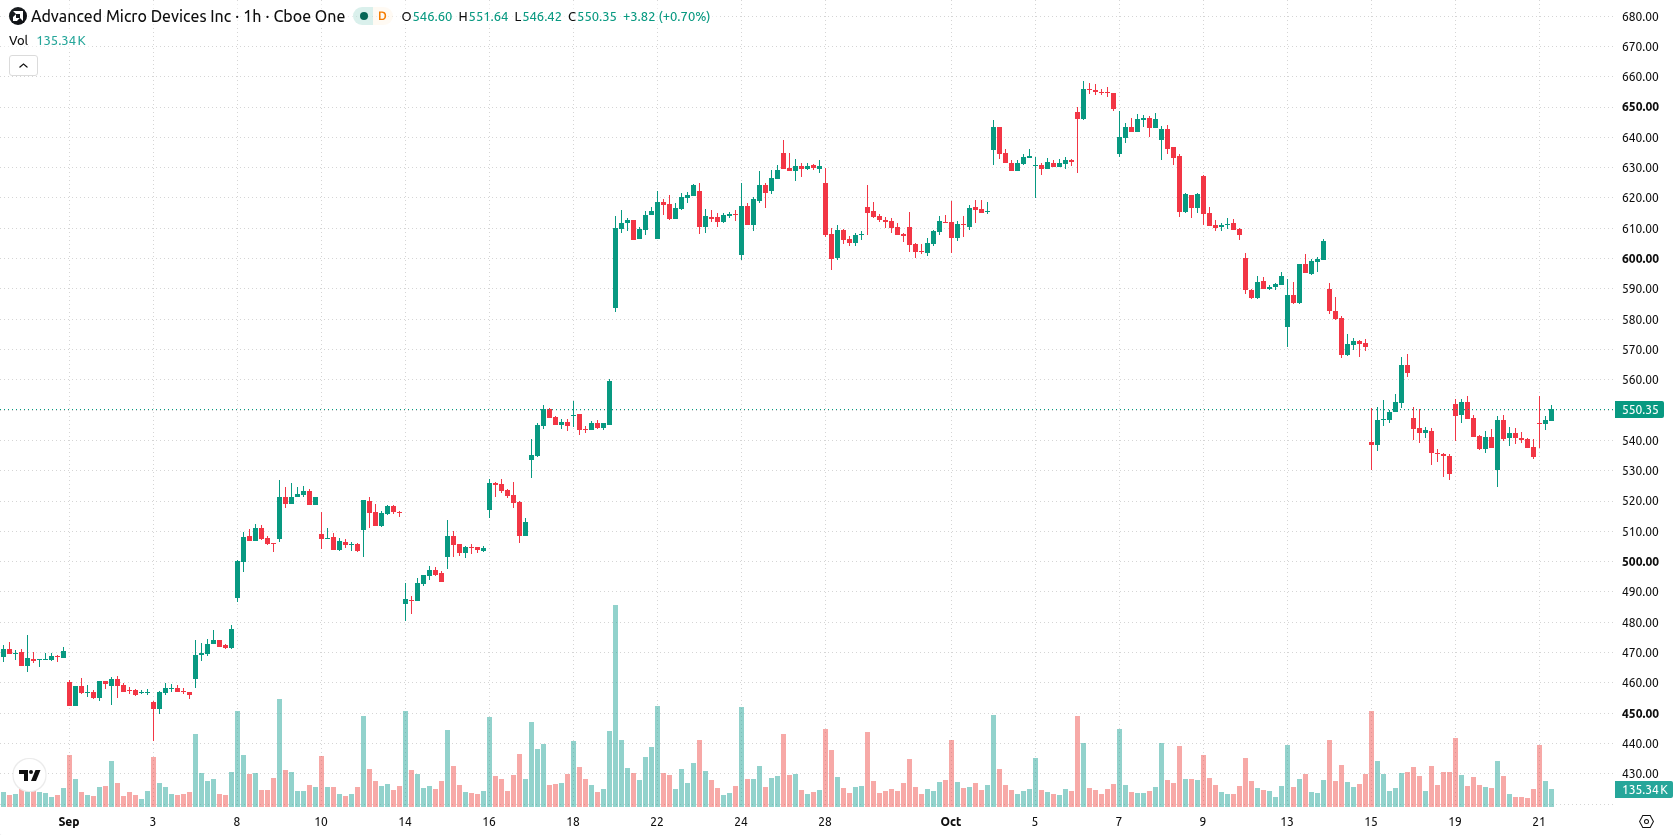
AMD (AMD) stock is trading at $550.01, up 2.87% today. The price sits above its key short-term moving average but remains below the medium-term average, while staying well above longer-term support areas.
 519.58
578.75
Highlights
- Shares of AMD have gained nearly 150% year to date, drawing aggressive investor focus and amplifying volatility.
- A rapid 13% weekly decline in AMD stock has raised near-term valuation concerns among market participants.
- Technical indicators show weak momentum and dominant sellers, with price expected to range from $531.71 to $568.31 over four days.
Recent rally and selling intensify volatility as sentiment adjusts
AMD has posted a nearly 150% gain so far this year, setting the stage for aggressive investor interest and increased volatility according to 24/7 Wall St. This dramatic advance has been followed by a sharp 13% weekly decline, which may have prompted some market participants to reassess near-term risk and valuation. Both the extent of the year-to-date rally and the recent correction have combined to drive today’s active trading environment.
Weak intraday momentum as price holds technical support
On the h1 chart, AMD trades above its MA-20 but remains below the MA-50, while on the daily timeframe it is well above the MA-200. The Ichimoku Kijun at $546.61 serves as immediate support. Weak momentum persists, as reflected by MACD (Strong Sell), ADX (Sell), RSI at 39.7 (Sell), and CCI signaling Sell. Both Stochastic RSI and Bull/Bear Power highlight oversold conditions, showing the balance remains in favor of sellers intraday. The Awesome Oscillator is neutral, indicating a lack of decisive confirmation from momentum indicators.
Downside risk prevails as volatility range narrows
Looking ahead over the next four trading days, the anticipated price range for AMD is $531.71 to $568.31. With a 62% probability of a move lower, downside risk currently outweighs rebound prospects. In the baseline scenario, AMD is likely to consolidate within this volatility band; a break above resistance could accelerate gains, while a drop below immediate support may lead to further declines.
Previously it was reported that AMD faced lingering downside risks despite strong growth, with signs emerging of a potential rebound from oversold technical conditions. The current analysis adds that while sellers still hold a short-term edge, traders should monitor the $546.61 Ichimoku Kijun level as a key support, as any sustained move below this threshold could accelerate further declines within the projected four-day range.











-
 Afghanistan
-
 Albania
-
 Algeria
-
 Angola
-
 Argentina
-
 Armenia
-
 Australia
-
 Austria
-
 Azerbaijan
-
 Bahamas
-
 Bahrain
-
 Bangladesh
-
 Belarus
-
 Belgium
-
 Bolivia
-
 Botswana
-
 Brazil
-
 Brunei
-
 Bulgaria
-
 Cambodia
-
 Cameroon
-
 Canada
-
 Chile
-
 China
-
 Colombia
-
 Congo
-
 Costa Rica
-
 Cote d'Ivoire
-
 Croatia
-
 Cuba
-
 Cyprus
-
 Czechia
-
 DR Congo
-
 Denmark
-
 Dominican Republic
-
 Ecuador
-
 Egypt
-
 El Salvador
-
 Estonia
-
 Eswatini
-
 Ethiopia
-
 Finland
-
 France
-
 Georgia
-
 Germany
-
 Ghana
-
 Greece
-
 Haiti
-
 Hong Kong
-
 Hungary
-
 India
-
 Indonesia
-
 Iran, Islamic republic
-
 Iraq
-
 Ireland
-
 Israel
-
 Italy
-
 Jamaica
-
 Japan
-
 Jordan
-
 Kazakhstan
-
 Kenya
-
 Korea
-
 Kuwait
-
 Kyrgyzstan
-
 Laos
-
 Latvia
-
 Lebanon
-
 Lesotho
-
 Libya
-
 Lithuania
-
 Luxembourg
-
 Madagascar
-
 Malaysia
-
 Malta
-
 Mauritius
-
 Mexico
-
 Moldova
-
 Mongolia
-
 Montenegro
-
 Morocco
-
 Mozambique
-
 Myanmar
-
 Namibia
-
 Nepal
-
 Netherlands
-
 New Zealand
-
 Nigeria
-
 North Macedonia
-
 Norway
-
 Oman
-
 Pakistan
-
 Palestine
-
 Panama
-
 Papua New Guinea
-
 Paraguay
-
 Peru
-
 Philippines
-
 Poland
-
 Portugal
-
 Puerto Rico
-
 Qatar
-
 Reunion
-
 Romania
-
 Rwanda
-
 Saudi Arabia
-
 Serbia
-
 Singapore
-
 Slovakia
-
 Slovenia
-
 Somalia
-
 South Africa
-
 Spain
-
 Sri Lanka
-
 Sweden
-
 Switzerland
-
 Syria
-
 Taiwan
-
 Tajikistan
-
 Tanzania
-
 Thailand
-
 Trinidad and Tobago
-
 Tunisia
-
 Turkey
-
 UAE
-
 Uganda
-
 Ukraine
-
 United Kingdom
-
United States
-
 Uruguay
-
 Uzbekistan
-
 Venezuela
-
 Vietnam
-
 Yemen
-
 Zambia
-
 Zimbabwe
- Forex
- Crypto












