

National Grid shares technical analysis: Consolidation persists near key support at GBX1,189

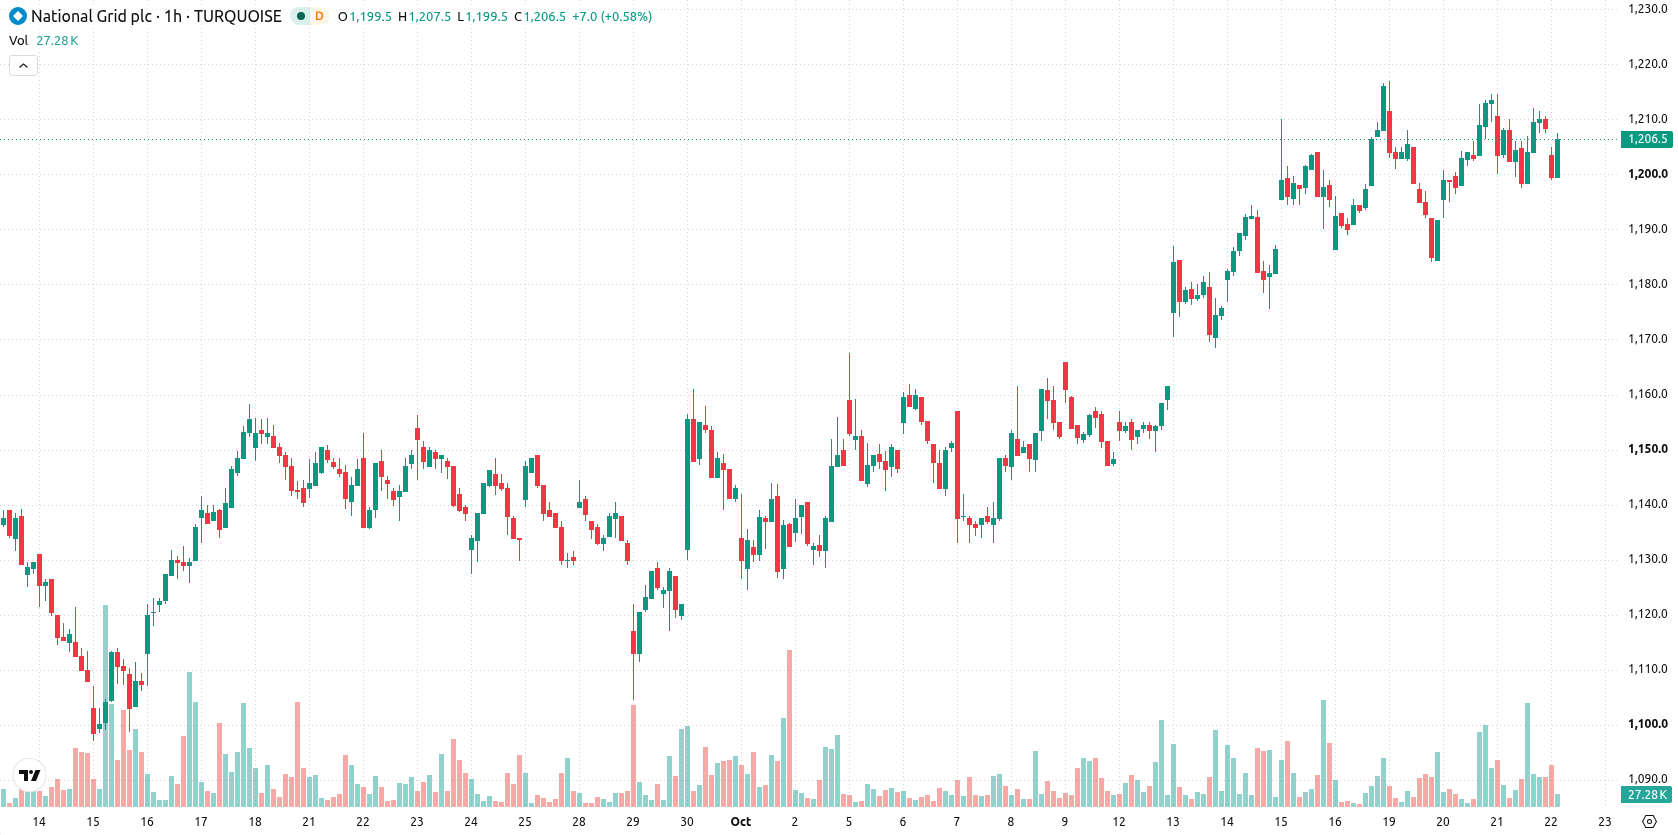
National Grid (NG) stock is trading at GBX1,204 after a slight decrease in the latest session. The price remains between its medium- and long-term moving averages on low volatility, reflecting a modest daily movement.
 1261.50
1262.50
Highlights
- NG/GBX stock trades below both short-term and long-term moving averages, indicating ongoing selling pressure in these timeframes.
- Momentum signals are mixed, with strong buying pressure in some oscillators but neutral or overbought readings in others, pointing to possible risk of reversal.
- Expected price range for the next few sessions is GBX1,189 to GBX1,218, with a 65% probability for an upward move and consolidation likely unless price breaches these levels.
Divergent technical momentum as buyers test support zone
The NG price is currently below the MA-20 and MA-200 levels, while still holding above the MA-50, highlighting support in the medium term with pressure from both short- and long-term averages. The Ichimoku Kijun lies at GBX1,200, offering a key immediate support level. Momentum indicators are mixed: MACD shows strong buying, ADX is neutral, RSI is at 52.29 and indicates buy, while Stochastic RSI signals a strong buy. Both CCI and Awesome Oscillator remain neutral, and Bull/Bear Power is in overbought territory, implying buyers retain dominance. Intraday action saw a minor 0.33% slip and a negative gap of 5, but the price continues to trade near the session high amid limited volatility. Oscillator extremes suggest a lingering upward impulse, although divergences point to some risk of reversal should bullish momentum ease.
Bullish breakout favored while volatility band limits downside
Over the coming sessions, the price is expected to consolidate within a volatility band of GBX1,189 to GBX1,218. The probability of an upward breakout stands at 65%, while a move lower remains less likely at 35%. If the price breaks cleanly above the GBX1,218 resistance, further gains become probable; conversely, a drop below GBX1,189 would expose the stock to additional downside risk.
Earlier, analysts noted that National Grid was demonstrating technical strength in the short to medium term, but faced persistent long-term resistance and the potential for price consolidation. The current analysis adds nuance by highlighting mixed momentum and ongoing consolidation within a defined volatility band, making GBX1,189 a critical level to monitor for signs of a potential shift in direction.









-
 Afghanistan
-
 Albania
-
 Algeria
-
 Angola
-
 Argentina
-
 Armenia
-
 Australia
-
 Austria
-
 Azerbaijan
-
 Bahamas
-
 Bahrain
-
 Bangladesh
-
 Belarus
-
 Belgium
-
 Bolivia
-
 Botswana
-
 Brazil
-
 Brunei
-
 Bulgaria
-
 Cambodia
-
 Cameroon
-
 Canada
-
 Chile
-
 China
-
 Colombia
-
 Congo
-
 Costa Rica
-
 Cote d'Ivoire
-
 Croatia
-
 Cuba
-
 Cyprus
-
 Czechia
-
 DR Congo
-
 Denmark
-
 Dominican Republic
-
 Ecuador
-
 Egypt
-
 El Salvador
-
 Estonia
-
 Eswatini
-
 Ethiopia
-
 Finland
-
 France
-
 Georgia
-
 Germany
-
 Ghana
-
 Greece
-
 Haiti
-
 Hong Kong
-
 Hungary
-
 India
-
 Indonesia
-
 Iran, Islamic republic
-
 Iraq
-
 Ireland
-
 Israel
-
 Italy
-
 Jamaica
-
 Japan
-
 Jordan
-
 Kazakhstan
-
 Kenya
-
 Korea
-
 Kuwait
-
 Kyrgyzstan
-
 Laos
-
 Latvia
-
 Lebanon
-
 Lesotho
-
 Libya
-
 Lithuania
-
 Luxembourg
-
 Madagascar
-
 Malaysia
-
 Malta
-
 Mauritius
-
 Mexico
-
 Moldova
-
 Mongolia
-
 Montenegro
-
 Morocco
-
 Mozambique
-
 Myanmar
-
 Namibia
-
 Nepal
-
 Netherlands
-
 New Zealand
-
 Nigeria
-
 North Macedonia
-
 Norway
-
 Oman
-
 Pakistan
-
 Palestine
-
 Panama
-
 Papua New Guinea
-
 Paraguay
-
 Peru
-
 Philippines
-
 Poland
-
 Portugal
-
 Puerto Rico
-
 Qatar
-
 Reunion
-
 Romania
-
 Rwanda
-
 Saudi Arabia
-
 Serbia
-
 Singapore
-
 Slovakia
-
 Slovenia
-
 Somalia
-
 South Africa
-
 Spain
-
 Sri Lanka
-
 Sweden
-
 Switzerland
-
 Syria
-
 Taiwan
-
 Tajikistan
-
 Tanzania
-
 Thailand
-
 Trinidad and Tobago
-
 Tunisia
-
 Turkey
-
 UAE
-
 Uganda
-
 Ukraine
-
 United Kingdom
-
United States
-
 Uruguay
-
 Uzbekistan
-
 Venezuela
-
 Vietnam
-
 Yemen
-
 Zambia
-
 Zimbabwe
- Forex
- Crypto












