

Earnings event shapes Suncor Energy stock while support comes into focus

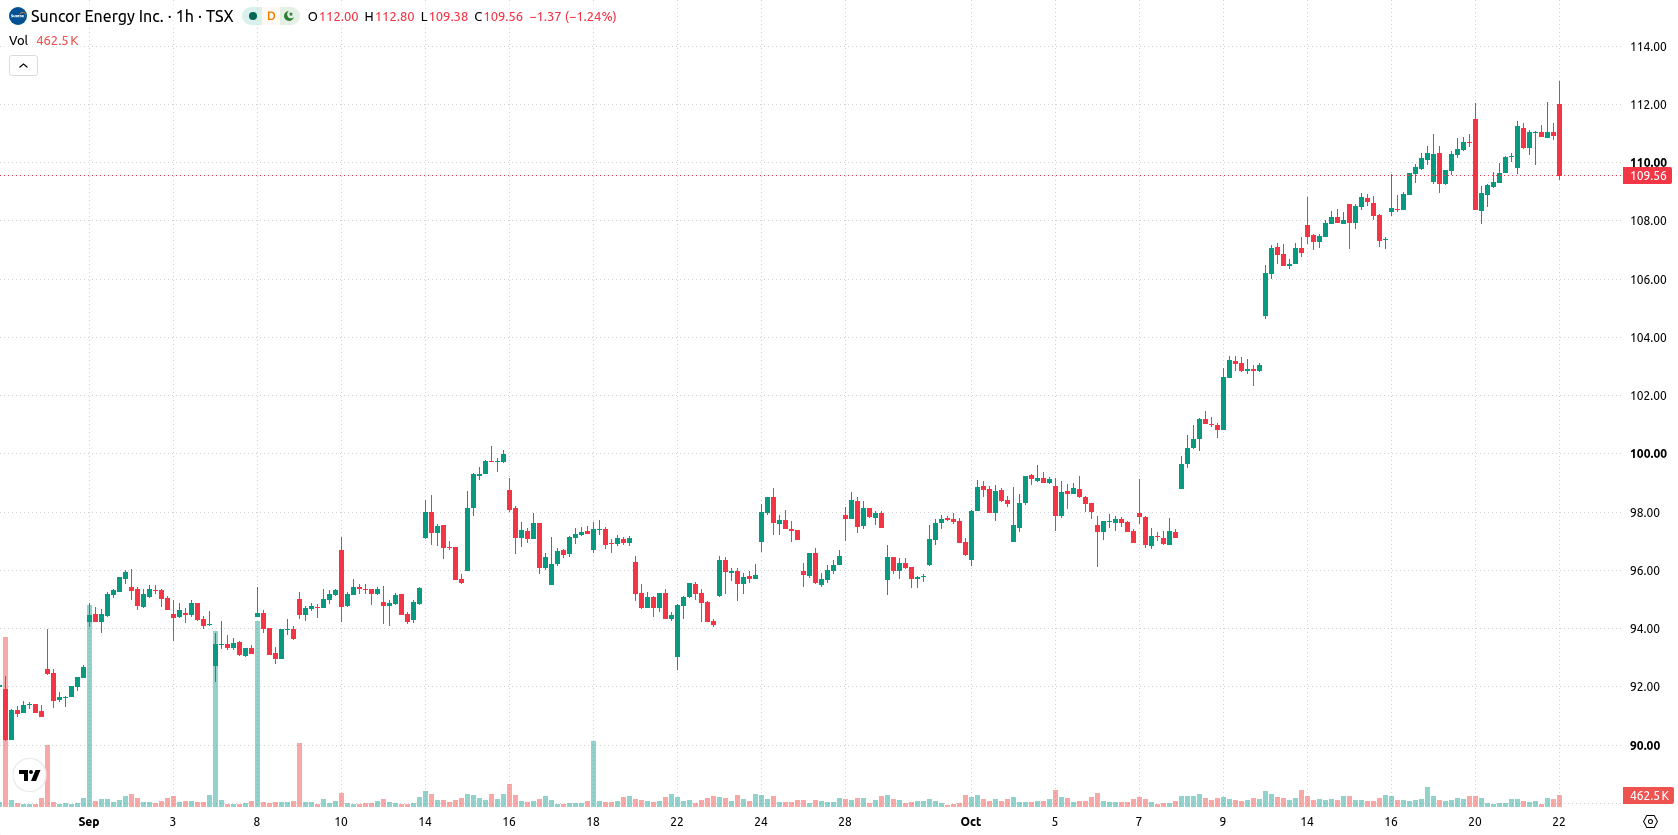
Suncor Energy Inc. (SU) stock is trading at C$109.07, posting a daily decline of 1.62%. The price currently sits below its key short-term moving averages while maintaining a position above the longer-term supports.
 97.35
99.76
Highlights
- Suncor Energy will announce third quarter 2026 results on November 3, with a management webcast and analyst Q&A session scheduled the following day.
- Market attention is on Suncor's upcoming earnings release, increasing short-term uncertainty as traders assess potential surprises.
- Suncor Energy stock closed at C$109.07, with mixed technical signals and an expected short-term trading range of C$106.98 to C$111.53.
Earnings anticipation heightens uncertainty as traders adjust positions
Suncor Energy has confirmed it will report its third quarter 2026 results on November 3, accompanied by a management webcast and analyst Q&A session the next day, according to Simplywall. This announcement places the market's focus on upcoming earnings disclosure, heightening short-term uncertainty as traders may reposition in advance of potential surprises. The event timing shapes expectations and could contribute to the observed shift in sentiment ahead of results.
Bullish momentum clashes with resistance amid mixed technical signals
Technically, SU is trading below the MA-20 at C$110.19, while remaining above the MA-50 at C$108.82 and the MA-200 at C$86.34. The Ichimoku Kijun level at C$109.97 suggests immediate resistance, with C$106.98 acting as near-term support. Among momentum signals, MACD and ADX both show strong buy signals, and RSI stands elevated at 61.73. CCI also points to a buy, but Stoch RSI is neutral and Bull/Bear Power reveals overbought conditions, reflecting dominant buyer presence intraday. The Awesome Oscillator remains neutral, highlighting a divergence between price weakness and the predominantly bullish indicator readings.
Consolidation seen as price volatility defines near-term breakout risk
In the near-term, SU is expected to consolidate within a range of C$106.98 to C$111.53 based on typical volatility scenarios. Upside probability is estimated at 70%, with a 30% chance for downward movement. The baseline case projects price action remaining within this channel, while a break above C$109.97 would favor a push toward the upper bound. Conversely, a drop below C$106.98 could trigger further weakness and extend the current corrective phase.
Earlier, analysts noted Suncor Energy was demonstrating renewed technical strength as it traded above key moving averages ahead of its upcoming earnings release. The current article signals a shift, with the stock slipping below short-term trend indicators and heightening the importance of C$109.97 as an immediate resistance level to watch for signs of fresh directional momentum.








-
 Afghanistan
-
 Albania
-
 Algeria
-
 Angola
-
 Argentina
-
 Armenia
-
 Australia
-
 Austria
-
 Azerbaijan
-
 Bahamas
-
 Bahrain
-
 Bangladesh
-
 Belarus
-
 Belgium
-
 Bolivia
-
 Botswana
-
 Brazil
-
 Brunei
-
 Bulgaria
-
 Cambodia
-
 Cameroon
-
 Canada
-
 Chile
-
 China
-
 Colombia
-
 Congo
-
 Costa Rica
-
 Cote d'Ivoire
-
 Croatia
-
 Cuba
-
 Cyprus
-
 Czechia
-
 DR Congo
-
 Denmark
-
 Dominican Republic
-
 Ecuador
-
 Egypt
-
 El Salvador
-
 Estonia
-
 Eswatini
-
 Ethiopia
-
 Finland
-
 France
-
 Georgia
-
 Germany
-
 Ghana
-
 Greece
-
 Haiti
-
 Hong Kong
-
 Hungary
-
 India
-
 Indonesia
-
 Iran, Islamic republic
-
 Iraq
-
 Ireland
-
 Israel
-
 Italy
-
 Jamaica
-
 Japan
-
 Jordan
-
 Kazakhstan
-
 Kenya
-
 Korea
-
 Kuwait
-
 Kyrgyzstan
-
 Laos
-
 Latvia
-
 Lebanon
-
 Lesotho
-
 Libya
-
 Lithuania
-
 Luxembourg
-
 Madagascar
-
 Malaysia
-
 Malta
-
 Mauritius
-
 Mexico
-
 Moldova
-
 Mongolia
-
 Montenegro
-
 Morocco
-
 Mozambique
-
 Myanmar
-
 Namibia
-
 Nepal
-
 Netherlands
-
 New Zealand
-
 Nigeria
-
 North Macedonia
-
 Norway
-
 Oman
-
 Pakistan
-
 Palestine
-
 Panama
-
 Papua New Guinea
-
 Paraguay
-
 Peru
-
 Philippines
-
 Poland
-
 Portugal
-
 Puerto Rico
-
 Qatar
-
 Reunion
-
 Romania
-
 Rwanda
-
 Saudi Arabia
-
 Serbia
-
 Singapore
-
 Slovakia
-
 Slovenia
-
 Somalia
-
 South Africa
-
 Spain
-
 Sri Lanka
-
 Sweden
-
 Switzerland
-
 Syria
-
 Taiwan
-
 Tajikistan
-
 Tanzania
-
 Thailand
-
 Trinidad and Tobago
-
 Tunisia
-
 Turkey
-
 UAE
-
 Uganda
-
 Ukraine
-
 United Kingdom
-
United States
-
 Uruguay
-
 Uzbekistan
-
 Venezuela
-
 Vietnam
-
 Yemen
-
 Zambia
-
 Zimbabwe
- Forex
- Crypto












