

National Grid stock consolidates near GBX1,221 as overbought conditions persist

National Grid (NG) stock is trading at GBX1,221, registering a modest decline for the day. The price currently sits above its key short- and medium-term moving averages, although longer-term resistance still exists.
 1263.50
1244.50
Highlights
- National Grid and Climate-i announced a project to cut SF6 gas emissions from electricity infrastructure by 50% by 2030.
- This initiative aims to minimize future regulatory and reputational risks and may improve appeal to ESG-focused investors.
- National Grid stock shows short- and medium-term bullish technical signals, with price forecast to consolidate between GBX1,203 and GBX1,238.
ESG sentiment advances as emissions project tempers immediate market impact
National Grid and Climate-i have initiated a collaborative project to address SF6 gas emissions from electricity infrastructure, with the stated goal of halving these emissions by 2030, according to Businessgreen. This move demonstrates a proactive approach to environmental compliance and is aimed at reducing future regulatory and reputational risks. Such efforts may enhance the company’s position among ESG-focused investors and support longer-term sentiment, but the immediate market impact remains muted in today’s session.
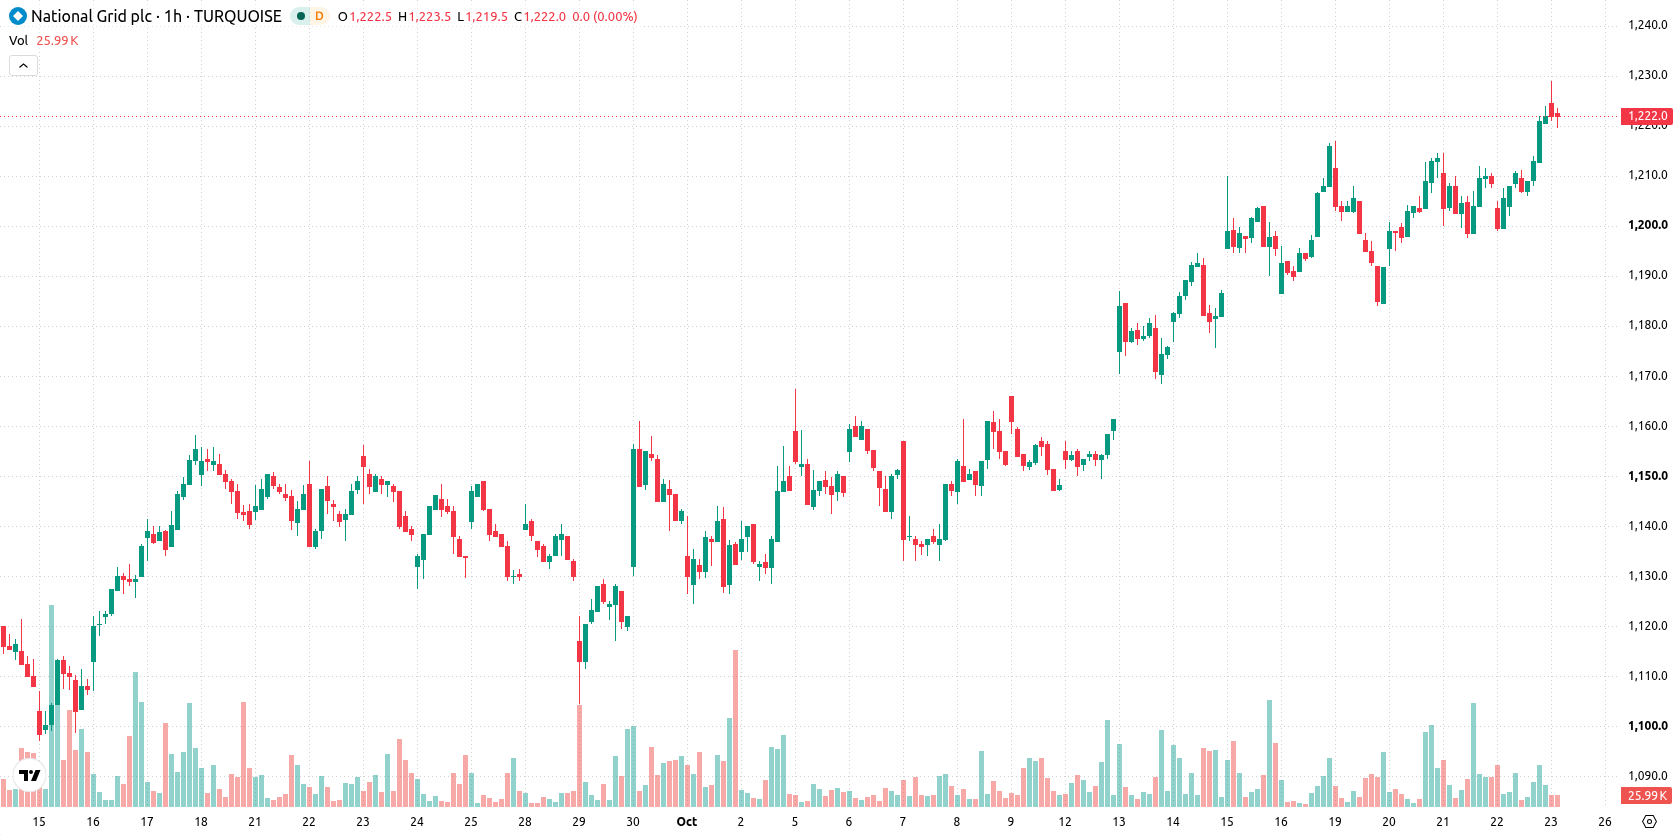
Bullish momentum persists as overbought signals clash with resistance
The hourly chart shows NG is above the MA-20 at GBX1,209 and MA-50 at GBX1,203, while resistance stands at the daily MA-200 at GBX1,236. The Ichimoku Kijun sits at GBX1,210, providing immediate support. Momentum indicators are largely positive: MACD signals a Buy, ADX remains Neutral, and RSI is at 67.52, also suggesting a Buy. Stoch RSI, CCI, and Bull/Bear Power all confirm overbought conditions and buyer dominance, with the Awesome Oscillator supporting further upside momentum. Price action near the session low and a small gap at the open suggest mild divergence between intraday movement and overall bullish momentum.
Consolidation anticipated as intraday volatility tests breakout potential
In the immediate term, the price is expected to remain within a GBX1,203 to GBX1,238 range, indicating a typical volatility band relative to current levels. The baseline scenario sees consolidation within this range. If buying momentum accelerates, a move above resistance could trigger further gains. A downside break through support would risk additional short-term losses, although this scenario appears less probable based on current momentum signals.
Earlier, analysts noted that National Grid was exhibiting technical consolidation with mixed momentum, as buyers tested key support areas amid ongoing long-term resistance. The current analysis adds a further dimension by highlighting continued buyer dominance alongside environmental initiatives, making sustained performance above the prevailing volatility band a critical indicator to watch for potential upside.









-
 Afghanistan
-
 Albania
-
 Algeria
-
 Angola
-
 Argentina
-
 Armenia
-
 Australia
-
 Austria
-
 Azerbaijan
-
 Bahamas
-
 Bahrain
-
 Bangladesh
-
 Belarus
-
 Belgium
-
 Bolivia
-
 Botswana
-
 Brazil
-
 Brunei
-
 Bulgaria
-
 Cambodia
-
 Cameroon
-
 Canada
-
 Chile
-
 China
-
 Colombia
-
 Congo
-
 Costa Rica
-
 Cote d'Ivoire
-
 Croatia
-
 Cuba
-
 Cyprus
-
 Czechia
-
 DR Congo
-
 Denmark
-
 Dominican Republic
-
 Ecuador
-
 Egypt
-
 El Salvador
-
 Estonia
-
 Eswatini
-
 Ethiopia
-
 Finland
-
 France
-
 Georgia
-
 Germany
-
 Ghana
-
 Greece
-
 Haiti
-
 Hong Kong
-
 Hungary
-
 India
-
 Indonesia
-
 Iran, Islamic republic
-
 Iraq
-
 Ireland
-
 Israel
-
 Italy
-
 Jamaica
-
 Japan
-
 Jordan
-
 Kazakhstan
-
 Kenya
-
 Korea
-
 Kuwait
-
 Kyrgyzstan
-
 Laos
-
 Latvia
-
 Lebanon
-
 Lesotho
-
 Libya
-
 Lithuania
-
 Luxembourg
-
 Madagascar
-
 Malaysia
-
 Malta
-
 Mauritius
-
 Mexico
-
 Moldova
-
 Mongolia
-
 Montenegro
-
 Morocco
-
 Mozambique
-
 Myanmar
-
 Namibia
-
 Nepal
-
 Netherlands
-
 New Zealand
-
 Nigeria
-
 North Macedonia
-
 Norway
-
 Oman
-
 Pakistan
-
 Palestine
-
 Panama
-
 Papua New Guinea
-
 Paraguay
-
 Peru
-
 Philippines
-
 Poland
-
 Portugal
-
 Puerto Rico
-
 Qatar
-
 Reunion
-
 Romania
-
 Rwanda
-
 Saudi Arabia
-
 Serbia
-
 Singapore
-
 Slovakia
-
 Slovenia
-
 Somalia
-
 South Africa
-
 Spain
-
 Sri Lanka
-
 Sweden
-
 Switzerland
-
 Syria
-
 Taiwan
-
 Tajikistan
-
 Tanzania
-
 Thailand
-
 Trinidad and Tobago
-
 Tunisia
-
 Turkey
-
 UAE
-
 Uganda
-
 Ukraine
-
 United Kingdom
-
United States
-
 Uruguay
-
 Uzbekistan
-
 Venezuela
-
 Vietnam
-
 Yemen
-
 Zambia
-
 Zimbabwe
- Forex
- Crypto












