

Microsoft boosts dividend and cloud growth: MSFT remains range-bound

Microsoft (MSFT) stock is trading at $525.06 after a modest gain for the session, sitting below its short- and medium-term moving averages but maintaining a position above major long-term trend indicators.
 524.70
534.70
Highlights
- Microsoft announced a quarterly dividend increase to $0.98 per share, with an annualized payout of $3.92 and ex-dividend date on November 19, 2026.
- Azure cloud revenue now exceeds $100 billion annually and a $678 billion contracted backlog secures predictability for future earnings.
- Microsoft stock faces short- and medium-term selling pressure with bearish momentum indicators and is expected to trade between $518.29 to $531.83.
Dividend boost and cloud growth drive investor confidence amid heavy spending
Microsoft’s announcement of a higher quarterly dividend at $0.98 per share, with an ex-dividend date of November 19, 2026, and annualized payout increased to $3.92, highlights management’s continued emphasis on capital returns and ongoing profitability, as reported by Morningstar. Expansion of Azure cloud revenue beyond $100 billion annually further reinforces Microsoft’s leadership in cloud services, while a contracted backlog of $678 billion secures future revenues and earnings visibility. Substantial fiscal year 2026 capital expenditures aimed at data center and AI infrastructure, combined with new institutional stakes from major investors during the second quarter, establish a robust backdrop supporting long-term valuation assumptions.
Bearish momentum dominates as price nears resistance in oversold state
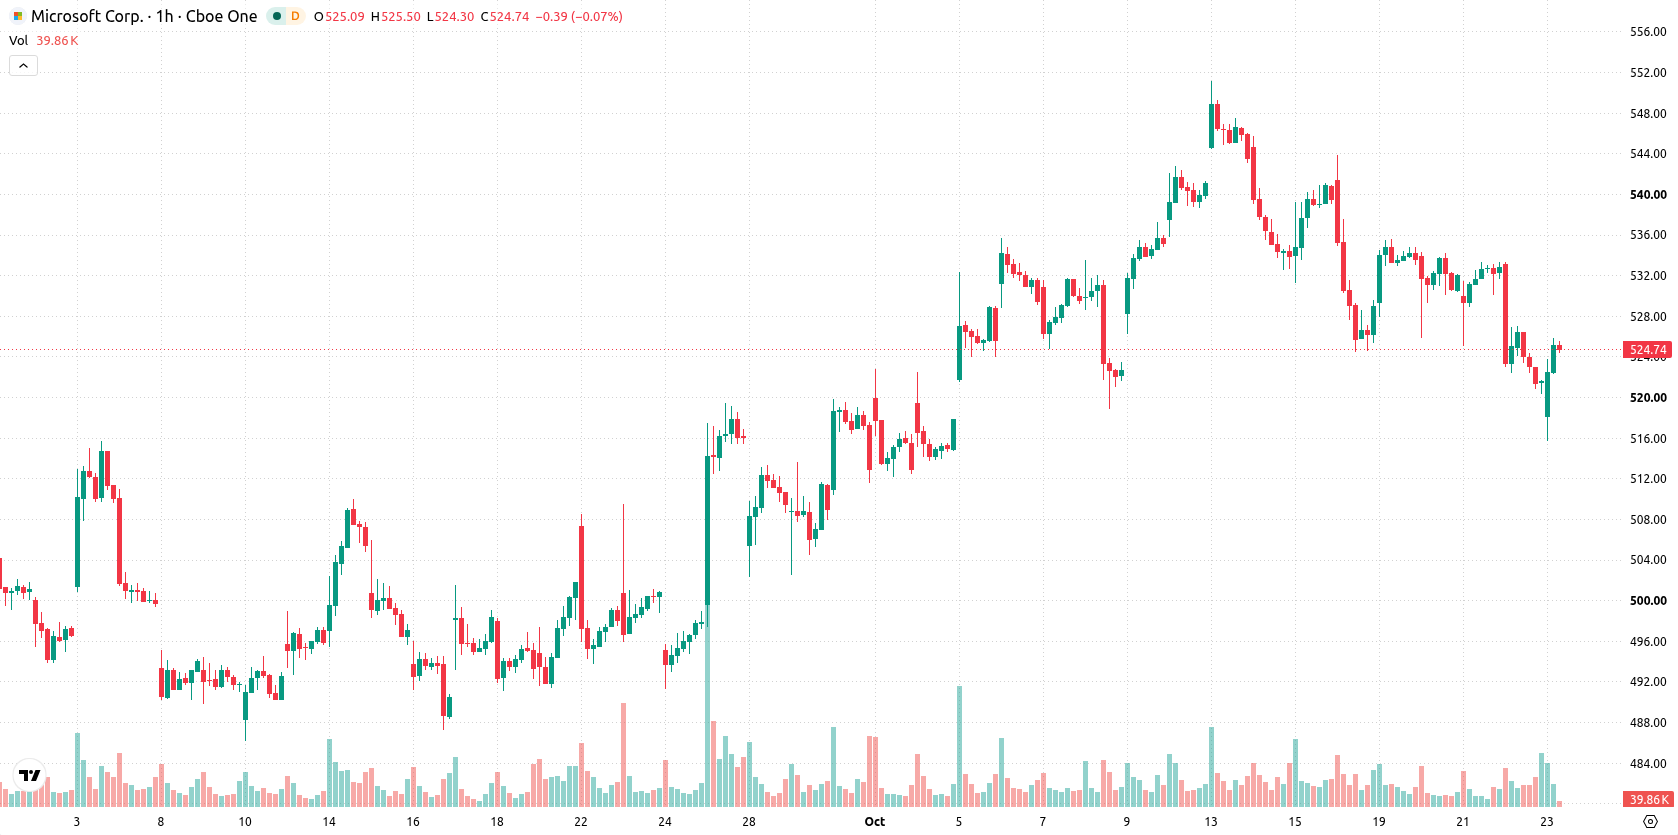
On the technical front, MSFT is holding above the MA-200 on the daily timeframe at $436.27, while remaining below both the MA-20 at $528.96 and MA-50 at $532.20 on the hourly chart. The Ichimoku Kijun at $527.97 serves as immediate resistance, with the next support and resistance levels pegged at $518.29 and $531.83, respectively. Momentum signals remain negative as both MACD and ADX indicate a bearish bias. At the same time, RSI, Stochastic RSI, and CCI point to oversold conditions, and the session’s Bull/Bear Power confirms seller dominance. The Awesome Oscillator aligns with the prevailing downward momentum, and although today’s session opened with a modest gap down, price has moved closer to the upper boundary of its intraday range.
Sideways trading expected as breakout hinges on resistance breach
Looking ahead over the next several days, MSFT is likely to trade sideways within the $518.29 to $531.83 corridor, with a 61% probability of a downward move and a 39% chance of an upside push. The baseline scenario anticipates typical volatility within the current band. However, a sustained bullish scenario would require a clean break above immediate resistance, while a sharper decline would be triggered if the price falls below the established support.
Earlier, analysts noted that heavyweight technology earnings and ongoing monetary policy decisions were becoming crucial tests for the sustainability of recent equity rallies. The current analysis adds a new dimension by emphasizing Microsoft's robust capital allocation and long-term revenue visibility, making the $518.29 support and $531.83 resistance levels critical pivots to watch for possible breakout or breakdown scenarios in the coming sessions.






Latest Microsoft News





-
 Afghanistan
-
 Albania
-
 Algeria
-
 Angola
-
 Argentina
-
 Armenia
-
 Australia
-
 Austria
-
 Azerbaijan
-
 Bahamas
-
 Bahrain
-
 Bangladesh
-
 Belarus
-
 Belgium
-
 Bolivia
-
 Botswana
-
 Brazil
-
 Brunei
-
 Bulgaria
-
 Cambodia
-
 Cameroon
-
 Canada
-
 Chile
-
 China
-
 Colombia
-
 Congo
-
 Costa Rica
-
 Cote d'Ivoire
-
 Croatia
-
 Cuba
-
 Cyprus
-
 Czechia
-
 DR Congo
-
 Denmark
-
 Dominican Republic
-
 Ecuador
-
 Egypt
-
 El Salvador
-
 Estonia
-
 Eswatini
-
 Ethiopia
-
 Finland
-
 France
-
 Georgia
-
 Germany
-
 Ghana
-
 Greece
-
 Haiti
-
 Hong Kong
-
 Hungary
-
 India
-
 Indonesia
-
 Iran, Islamic republic
-
 Iraq
-
 Ireland
-
 Israel
-
 Italy
-
 Jamaica
-
 Japan
-
 Jordan
-
 Kazakhstan
-
 Kenya
-
 Korea
-
 Kuwait
-
 Kyrgyzstan
-
 Laos
-
 Latvia
-
 Lebanon
-
 Lesotho
-
 Libya
-
 Lithuania
-
 Luxembourg
-
 Madagascar
-
 Malaysia
-
 Malta
-
 Mauritius
-
 Mexico
-
 Moldova
-
 Mongolia
-
 Montenegro
-
 Morocco
-
 Mozambique
-
 Myanmar
-
 Namibia
-
 Nepal
-
 Netherlands
-
 New Zealand
-
 Nigeria
-
 North Macedonia
-
 Norway
-
 Oman
-
 Pakistan
-
 Palestine
-
 Panama
-
 Papua New Guinea
-
 Paraguay
-
 Peru
-
 Philippines
-
 Poland
-
 Portugal
-
 Puerto Rico
-
 Qatar
-
 Reunion
-
 Romania
-
 Rwanda
-
 Saudi Arabia
-
 Serbia
-
 Singapore
-
 Slovakia
-
 Slovenia
-
 Somalia
-
 South Africa
-
 Spain
-
 Sri Lanka
-
 Sweden
-
 Switzerland
-
 Syria
-
 Taiwan
-
 Tajikistan
-
 Tanzania
-
 Thailand
-
 Trinidad and Tobago
-
 Tunisia
-
 Turkey
-
 UAE
-
 Uganda
-
 Ukraine
-
 United Kingdom
-
United States
-
 Uruguay
-
 Uzbekistan
-
 Venezuela
-
 Vietnam
-
 Yemen
-
 Zambia
-
 Zimbabwe
- Forex
- Crypto












