

LLY declines as overbought conditions weigh on upward momentum

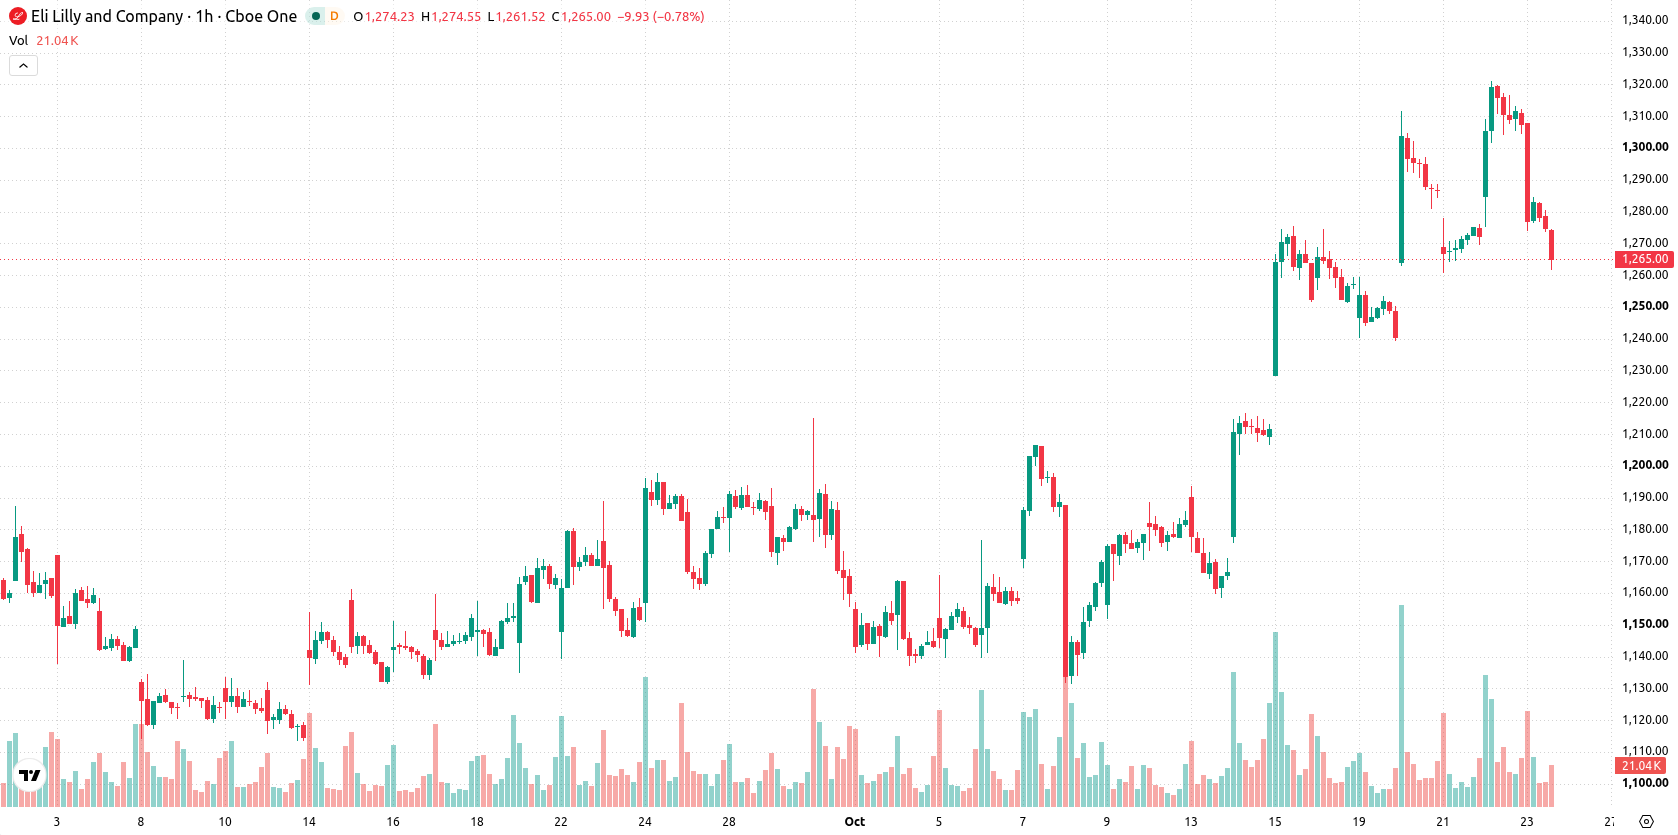
Eli Lilly (LLY) stock is trading at $1,265, marking a decline of 3.2% for the day. The share price is currently below its short-term moving average but still holds above the medium- and long-term trends.
 1436.72
Highlights
- Eli Lilly is investing $5 billion in a new Virginia facility to increase cancer therapy manufacturing capacity.
- Recent Phase 3 SHINE-2 trial results for Omvoh in pediatric ulcerative colitis showed strong clinical efficacy after one year.
- Shares of Eli Lilly are down 3.2% at $1,265 with expected short-term trading between $1,229 and $1,301 as technical indicators show buyer momentum but intraday weakness.
Growth investment and pipeline progress amid lingering selling pressure
Eli Lilly announced on October 22, 2026, the start of a $5 billion manufacturing facility in Goochland County, Virginia to expand its cancer therapy production, according to Gurufocus. This substantial investment marks a major scale-up in manufacturing capacity, positioning the company for future revenue growth but also committing significant capital resources. Additionally, on October 19, Eli Lilly recorded positive one-year Phase 3 SHINE-2 study results for Omvoh in pediatric ulcerative colitis, with strong clinical efficacy data reported by Wboc. Both developments indicate progress in pipeline advancement and operational scale, though price action has remained under broader selling pressure.
Momentum divergence as bullish signals meet resistance at key levels
Technically, LLY has slipped below its MA-20 but remains above both the MA-50 and long-term MA-200, indicating a mixed trend across timeframes. Immediate resistance is defined by the Ichimoku Kijun level at $1,280, which is currently capping short-term rebounds. On the indicator front, MACD and ADX reflect ongoing bullish momentum, while RSI and CCI both point to persistent buy conditions. Stoch RSI is neutral, Bull/Bear Power is overbought with buyers dominating, and Awesome Oscillator remains neutral, highlighting a divergence between strong momentum signals and ongoing intraday weakness.
Consolidation likely as modest upside bias faces defined volatility range
Over the next 2-3 trading days, LLY is expected to fluctuate within a $1,229 to $1,301 volatility band. The probability modestly favors upward moves at 55%, suggesting consolidation is likely. A break above the $1,280 resistance may open room for further gains, while a sustained move below the $1,229 support would signal increased downside risk.
Earlier, analysts noted that Eli Lilly was exhibiting continued operational expansion and strengthening demand, which supported a scenario of price consolidation unless a decisive breakout occurred. The current analysis adds a new dimension with significant manufacturing investment and promising pipeline data, positioning $1,280 as a critical level to watch for potential short-term reversals or sustained momentum.






Latest Eli Lilly and Company News




-
 Afghanistan
-
 Albania
-
 Algeria
-
 Angola
-
 Argentina
-
 Armenia
-
 Australia
-
 Austria
-
 Azerbaijan
-
 Bahamas
-
 Bahrain
-
 Bangladesh
-
 Belarus
-
 Belgium
-
 Bolivia
-
 Botswana
-
 Brazil
-
 Brunei
-
 Bulgaria
-
 Cambodia
-
 Cameroon
-
 Canada
-
 Chile
-
 China
-
 Colombia
-
 Congo
-
 Costa Rica
-
 Cote d'Ivoire
-
 Croatia
-
 Cuba
-
 Cyprus
-
 Czechia
-
 DR Congo
-
 Denmark
-
 Dominican Republic
-
 Ecuador
-
 Egypt
-
 El Salvador
-
 Estonia
-
 Eswatini
-
 Ethiopia
-
 Finland
-
 France
-
 Georgia
-
 Germany
-
 Ghana
-
 Greece
-
 Haiti
-
 Hong Kong
-
 Hungary
-
 India
-
 Indonesia
-
 Iran, Islamic republic
-
 Iraq
-
 Ireland
-
 Israel
-
 Italy
-
 Jamaica
-
 Japan
-
 Jordan
-
 Kazakhstan
-
 Kenya
-
 Korea
-
 Kuwait
-
 Kyrgyzstan
-
 Laos
-
 Latvia
-
 Lebanon
-
 Lesotho
-
 Libya
-
 Lithuania
-
 Luxembourg
-
 Madagascar
-
 Malaysia
-
 Malta
-
 Mauritius
-
 Mexico
-
 Moldova
-
 Mongolia
-
 Montenegro
-
 Morocco
-
 Mozambique
-
 Myanmar
-
 Namibia
-
 Nepal
-
 Netherlands
-
 New Zealand
-
 Nigeria
-
 North Macedonia
-
 Norway
-
 Oman
-
 Pakistan
-
 Palestine
-
 Panama
-
 Papua New Guinea
-
 Paraguay
-
 Peru
-
 Philippines
-
 Poland
-
 Portugal
-
 Puerto Rico
-
 Qatar
-
 Reunion
-
 Romania
-
 Rwanda
-
 Saudi Arabia
-
 Serbia
-
 Singapore
-
 Slovakia
-
 Slovenia
-
 Somalia
-
 South Africa
-
 Spain
-
 Sri Lanka
-
 Sweden
-
 Switzerland
-
 Syria
-
 Taiwan
-
 Tajikistan
-
 Tanzania
-
 Thailand
-
 Trinidad and Tobago
-
 Tunisia
-
 Turkey
-
 UAE
-
 Uganda
-
 Ukraine
-
 United Kingdom
-
United States
-
 Uruguay
-
 Uzbekistan
-
 Venezuela
-
 Vietnam
-
 Yemen
-
 Zambia
-
 Zimbabwe
- Forex
- Crypto












