

HSBA falls as seller pressure weighs on near-term direction

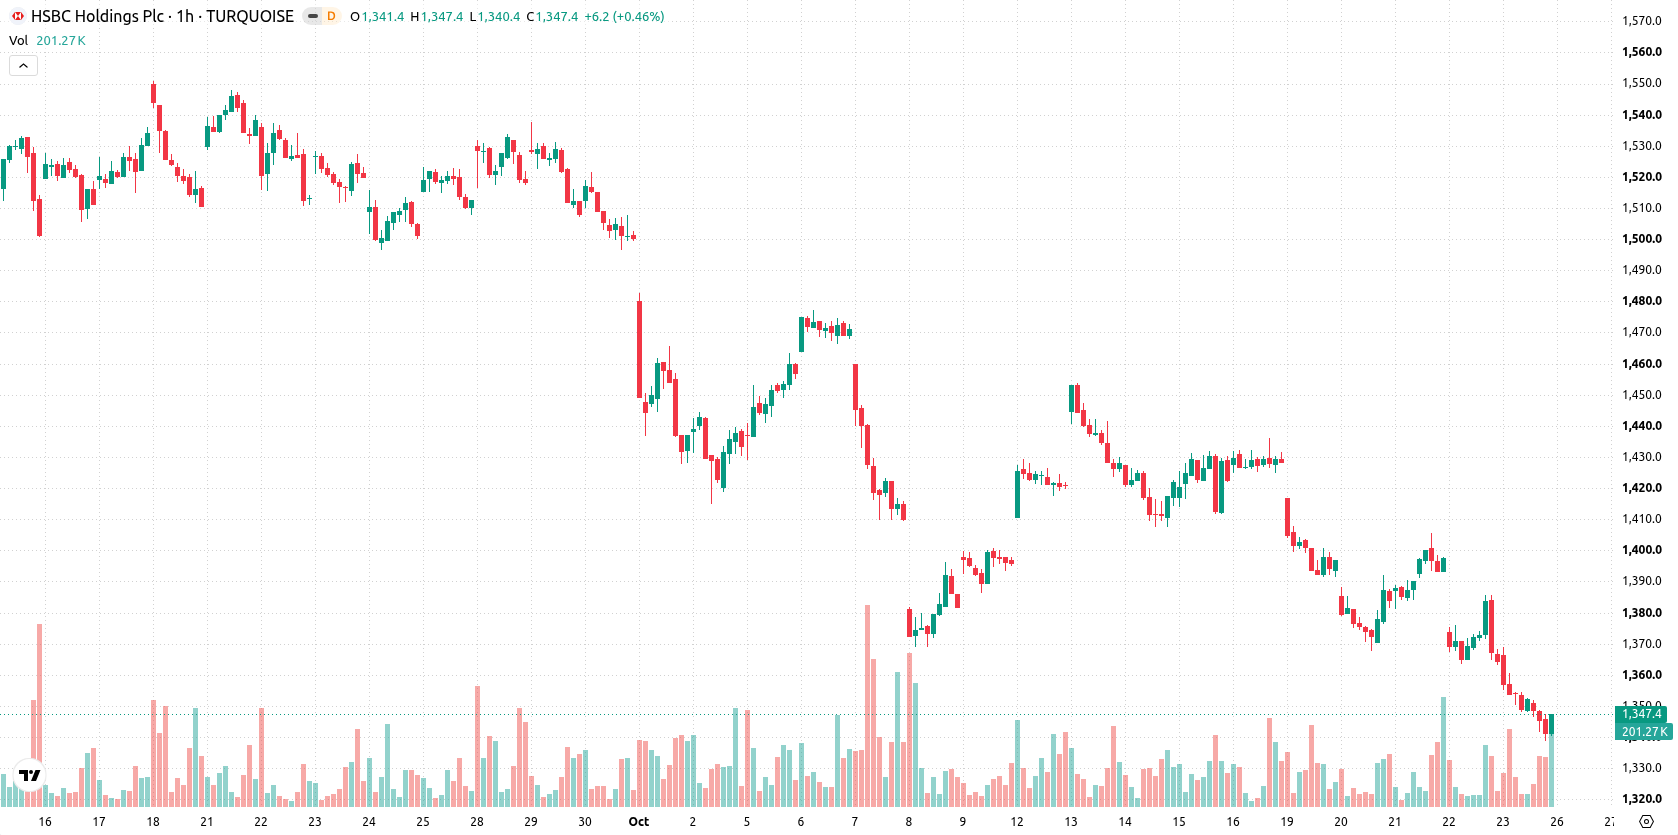
HSBC (HSBA) stock is trading at GBX1,347, down 1.4% for the day. The price remains below its key moving averages, reflecting ongoing selling pressure relative to recent trends.
 1301.80
1373.00
Highlights
- HSBC has introduced its Hong Kong dollar stablecoin, HSBC RedCoin, to over 3.3 million PayMe users, expanding its digital payment footprint.
- The stablecoin aims to boost transaction volumes and solidify HSBC's role in Hong Kong's competitive fintech space.
- Shares of HSBC remain under broad selling pressure, with technical signals bearish and expected to trade in the GBX1,311 to GBX1,382 range.
Stablecoin launch grows digital reach but fails to lift sentiment
HSBC has rolled out its Hong Kong dollar stablecoin, HSBC RedCoin, to more than 3.3 million users of its PayMe app since October 23, with the full release scheduled before the end of the weekend, according to Wublock Substack. The stablecoin launch expands HSBC’s digital payment capabilities and is designed to strengthen its presence in Hong Kong’s evolving fintech sector by driving transaction volumes through PayMe. While this is a notable step in digital innovation, price action has remained under broader selling pressure.
Oversold signals persist as momentum indicators show bearish bias
On the H1 timeframe, HSBA is trading below its MA-20 at GBX1,363 and MA-50 at GBX1,383, while the daily MA-200 stands at GBX1,386. The Ichimoku Kijun at GBX1,372 marks immediate resistance. MACD shows continued bearish momentum and ADX is neutral, indicating a lack of strong trend commitment. RSI is at 35.17, suggesting oversold conditions, and CCI is also in oversold territory. There is a divergence between Stoch RSI, which signals a strong buy, and other oscillators such as Bull/Bear Power and the Awesome Oscillator, both confirming ongoing seller dominance intraday.
Downside risk elevated as trading range caps near-term rebound
In the short term, HSBC is expected to fluctuate within a GBX1,311 to GBX1,382 band, reflecting typical volatility for the stock at current levels. The probability of an upward move stands at 35%, while the likelihood of further downside is higher at 65%, indicating a lower chance of an imminent breakout to the upside. The baseline scenario sees HSBA consolidating between these support and resistance levels. A break above the Kijun and clustered moving averages could prompt a rebound, while a dip below GBX1,311 would likely trigger another wave of selling.
Previously it was reported that HSBC completed its withdrawal from South Africa to refocus on markets more closely aligned with its global strategy. With ongoing selling pressure and a reduction in upside probability despite the bank's digital innovation efforts, the key level for traders to monitor now is a break of either GBX1,311 support or GBX1,372 resistance for signs of the next directional move.






Latest HSBC News




-
 Afghanistan
-
 Albania
-
 Algeria
-
 Angola
-
 Argentina
-
 Armenia
-
 Australia
-
 Austria
-
 Azerbaijan
-
 Bahamas
-
 Bahrain
-
 Bangladesh
-
 Belarus
-
 Belgium
-
 Bolivia
-
 Botswana
-
 Brazil
-
 Brunei
-
 Bulgaria
-
 Cambodia
-
 Cameroon
-
 Canada
-
 Chile
-
 China
-
 Colombia
-
 Congo
-
 Costa Rica
-
 Cote d'Ivoire
-
 Croatia
-
 Cuba
-
 Cyprus
-
 Czechia
-
 DR Congo
-
 Denmark
-
 Dominican Republic
-
 Ecuador
-
 Egypt
-
 El Salvador
-
 Estonia
-
 Eswatini
-
 Ethiopia
-
 Finland
-
 France
-
 Georgia
-
 Germany
-
 Ghana
-
 Greece
-
 Haiti
-
 Hong Kong
-
 Hungary
-
 India
-
 Indonesia
-
 Iran, Islamic republic
-
 Iraq
-
 Ireland
-
 Israel
-
 Italy
-
 Jamaica
-
 Japan
-
 Jordan
-
 Kazakhstan
-
 Kenya
-
 Korea
-
 Kuwait
-
 Kyrgyzstan
-
 Laos
-
 Latvia
-
 Lebanon
-
 Lesotho
-
 Libya
-
 Lithuania
-
 Luxembourg
-
 Madagascar
-
 Malaysia
-
 Malta
-
 Mauritius
-
 Mexico
-
 Moldova
-
 Mongolia
-
 Montenegro
-
 Morocco
-
 Mozambique
-
 Myanmar
-
 Namibia
-
 Nepal
-
 Netherlands
-
 New Zealand
-
 Nigeria
-
 North Macedonia
-
 Norway
-
 Oman
-
 Pakistan
-
 Palestine
-
 Panama
-
 Papua New Guinea
-
 Paraguay
-
 Peru
-
 Philippines
-
 Poland
-
 Portugal
-
 Puerto Rico
-
 Qatar
-
 Reunion
-
 Romania
-
 Rwanda
-
 Saudi Arabia
-
 Serbia
-
 Singapore
-
 Slovakia
-
 Slovenia
-
 Somalia
-
 South Africa
-
 Spain
-
 Sri Lanka
-
 Sweden
-
 Switzerland
-
 Syria
-
 Taiwan
-
 Tajikistan
-
 Tanzania
-
 Thailand
-
 Trinidad and Tobago
-
 Tunisia
-
 Turkey
-
 UAE
-
 Uganda
-
 Ukraine
-
 United Kingdom
-
United States
-
 Uruguay
-
 Uzbekistan
-
 Venezuela
-
 Vietnam
-
 Yemen
-
 Zambia
-
 Zimbabwe
- Forex
- Crypto












