


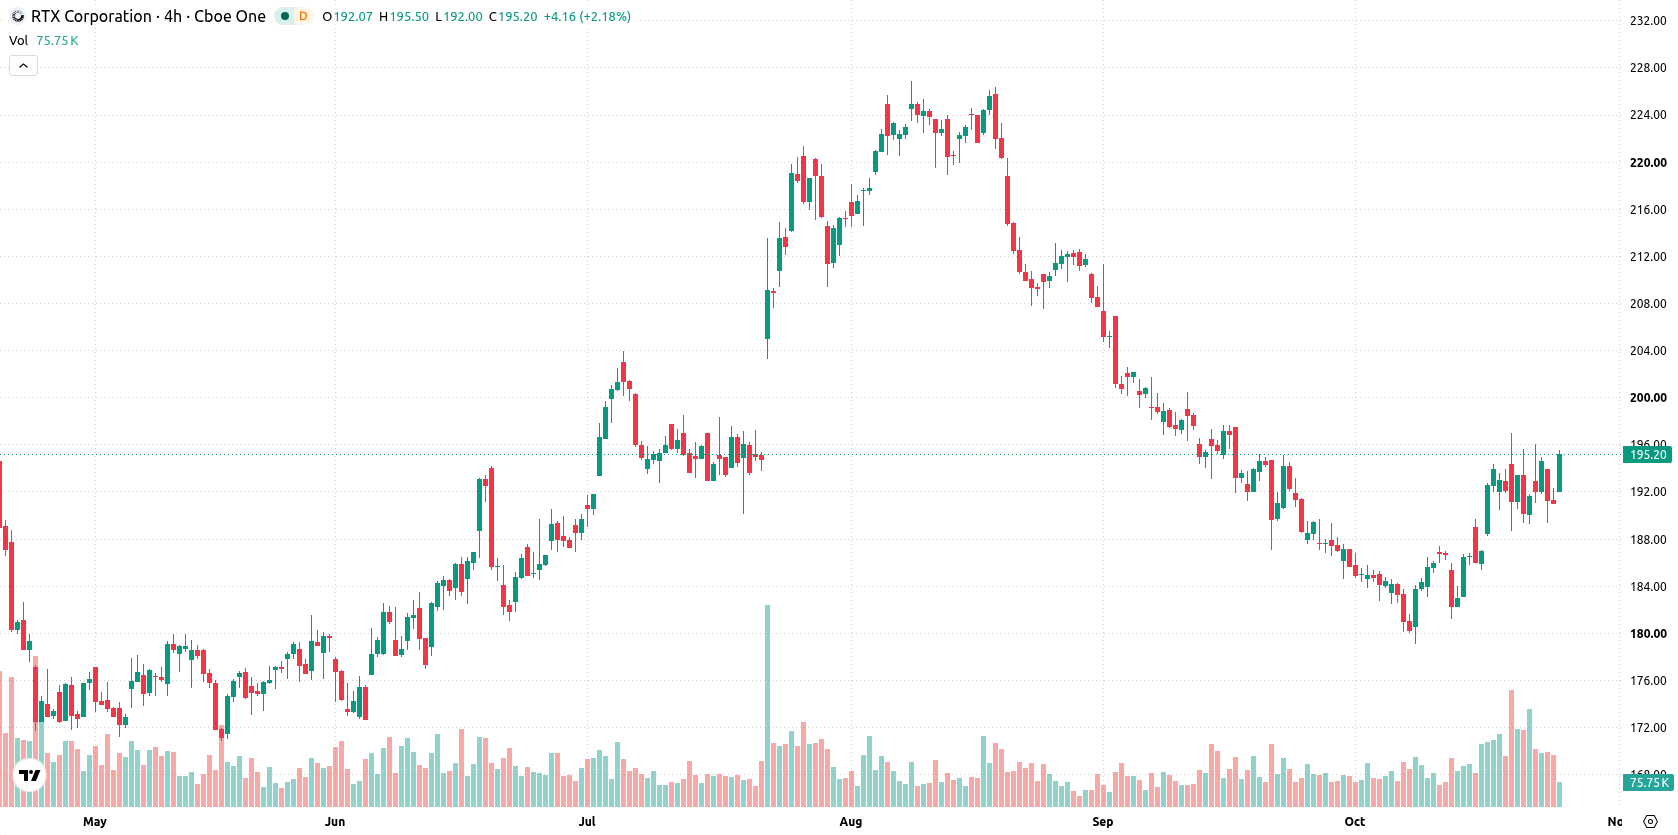
RTX Corporation (RTX) advanced 2.32% on building technical momentum and renewed buying interest, as the absence of fresh company-specific news places focus on short-term price action. The uptrend looks limited, with price still capped below the 50-day moving average and several overbought signals appearing across oscillators.
 198.69
197.93
Highlights
- RTX stock is trading above long-term support but remains below medium-term resistance, indicating a mixed trend setup.
- Momentum signals are conflicting, with oscillators showing overbought conditions and both buy and sell indicators currently split.
- RTX is expected to trade between $191.46 and $199.46 over the next 5 sessions, with a baseline sideways scenario and increased probability of a move lower.
Mixed technical signals as overbought risk meets reclaimed supports
RTX is trading above both the 20-day moving average ($187.4) and the 200-day moving average ($195.18), but remains below the 50-day moving average ($197.11). This pattern marks a short-term bullish move as price reclaims longer-term support levels, although medium-term momentum still lags. The near-term ceiling is $196.73, with support from the 200-day at $195.18, while the Ichimoku Kijun ($187.97) and daily averages create a supportive environment underneath. On the momentum side, MACD points to continued selling, but the ADX favors ongoing buying activity. The RSI sits just below neutral and hints at renewed selling interest, while the Stochastic RSI and Bull/Bear Power (BBP) both indicate overbought conditions. CCI and Awesome Oscillator (AO) suggest a buying bias. Despite buyers dominating intraday and price strength near session highs, technical signals remain mixed, and oscillators caution about overbought risk.
Earlier, analysts noted that RTX was experiencing a technical reversal with attention focused on its ability to overcome resistance or face an interim pullback. Given the current prevalence of mixed signals and an overbought backdrop, traders should monitor the $196.73 resistance level for a potential breakout or watch for downside risk if support at $195.18 fails.










-
 Afghanistan
-
 Albania
-
 Algeria
-
 Angola
-
 Argentina
-
 Armenia
-
 Australia
-
 Austria
-
 Azerbaijan
-
 Bahamas
-
 Bahrain
-
 Bangladesh
-
 Belarus
-
 Belgium
-
 Bolivia
-
 Botswana
-
 Brazil
-
 Brunei
-
 Bulgaria
-
 Cambodia
-
 Cameroon
-
 Canada
-
 Chile
-
 China
-
 Colombia
-
 Congo
-
 Costa Rica
-
 Cote d'Ivoire
-
 Croatia
-
 Cuba
-
 Cyprus
-
 Czechia
-
 DR Congo
-
 Denmark
-
 Dominican Republic
-
 Ecuador
-
 Egypt
-
 El Salvador
-
 Estonia
-
 Eswatini
-
 Ethiopia
-
 Finland
-
 France
-
 Georgia
-
 Germany
-
 Ghana
-
 Greece
-
 Haiti
-
 Hong Kong
-
 Hungary
-
 India
-
 Indonesia
-
 Iran, Islamic republic
-
 Iraq
-
 Ireland
-
 Israel
-
 Italy
-
 Jamaica
-
 Japan
-
 Jordan
-
 Kazakhstan
-
 Kenya
-
 Korea
-
 Kuwait
-
 Kyrgyzstan
-
 Laos
-
 Latvia
-
 Lebanon
-
 Lesotho
-
 Libya
-
 Lithuania
-
 Luxembourg
-
 Madagascar
-
 Malaysia
-
 Malta
-
 Mauritius
-
 Mexico
-
 Moldova
-
 Mongolia
-
 Montenegro
-
 Morocco
-
 Mozambique
-
 Myanmar
-
 Namibia
-
 Nepal
-
 Netherlands
-
 New Zealand
-
 Nigeria
-
 North Macedonia
-
 Norway
-
 Oman
-
 Pakistan
-
 Palestine
-
 Panama
-
 Papua New Guinea
-
 Paraguay
-
 Peru
-
 Philippines
-
 Poland
-
 Portugal
-
 Puerto Rico
-
 Qatar
-
 Reunion
-
 Romania
-
 Rwanda
-
 Saudi Arabia
-
 Serbia
-
 Singapore
-
 Slovakia
-
 Slovenia
-
 Somalia
-
 South Africa
-
 Spain
-
 Sri Lanka
-
 Sweden
-
 Switzerland
-
 Syria
-
 Taiwan
-
 Tajikistan
-
 Tanzania
-
 Thailand
-
 Trinidad and Tobago
-
 Tunisia
-
 Turkey
-
 UAE
-
 Uganda
-
 Ukraine
-
 United Kingdom
-
United States
-
 Uruguay
-
 Uzbekistan
-
 Venezuela
-
 Vietnam
-
 Yemen
-
 Zambia
-
 Zimbabwe
- Forex
- Crypto












