

Subscriber losses drag Comcast stock as downward price move accelerates selling interest

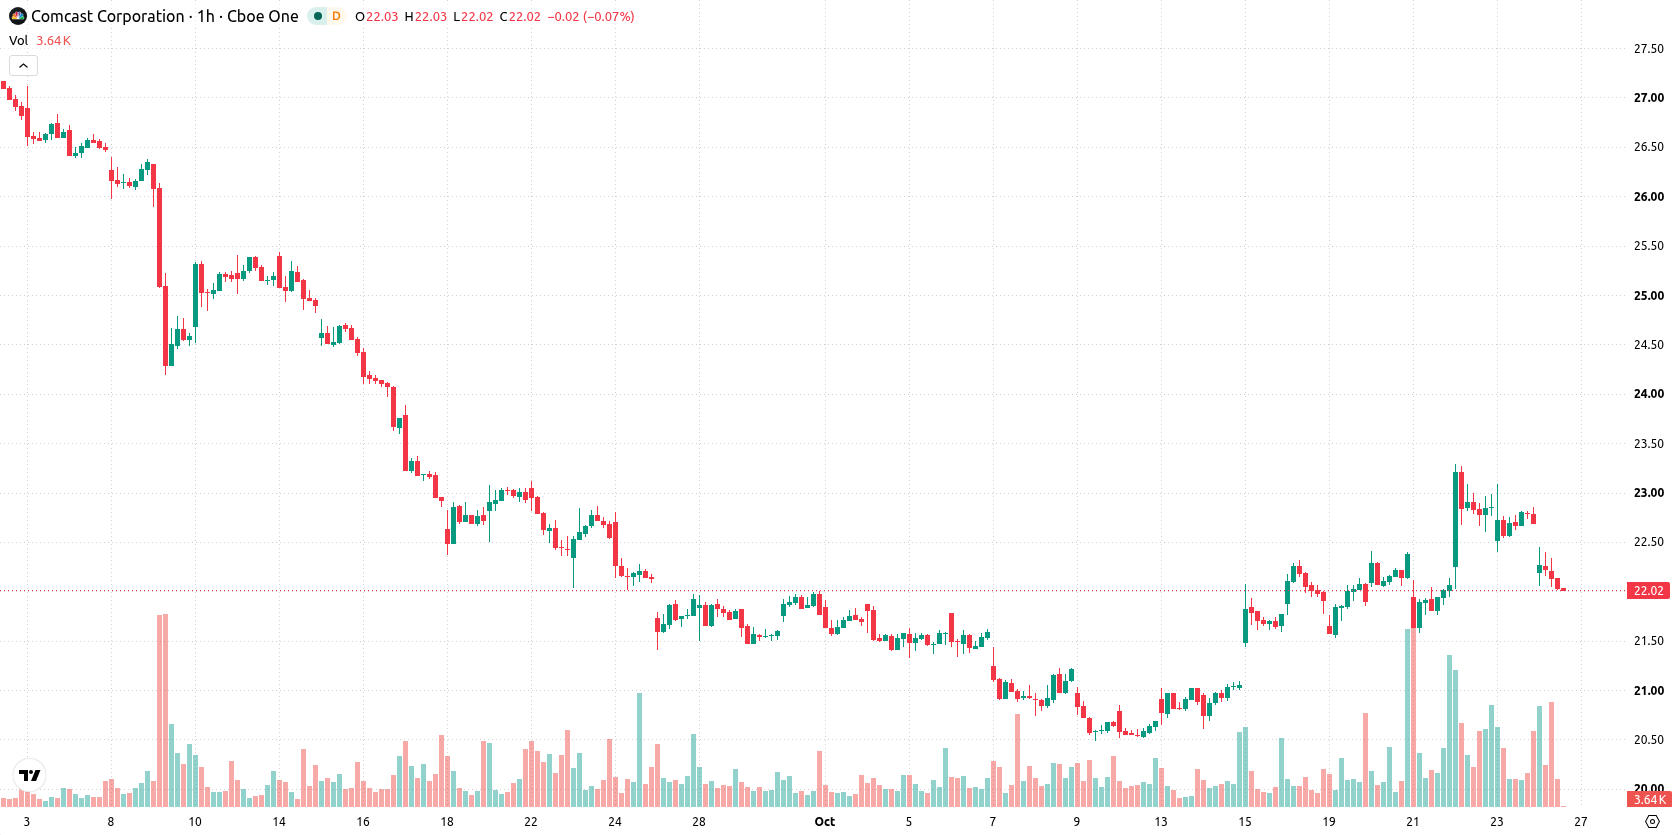
Comcast (CMCSA) stock is trading at $22.03, down 3.01% on the day. The price remains below its key moving averages, reflecting persistent downside momentum after a gap lower on moderate volatility.
 22.29
23.04
Highlights
- Comcast reported flat revenue for Q3 2026 as broadband subscriber losses and lower theme park results pressured core businesses.
- The company recorded profitable growth at Peacock and record wireless customer gains, but share repurchases remain paused and a restructuring charge above $1 billion is planned for Q4.
- Shares of Comcast trade below major moving averages with sustained intraday downside pressure, and the expected near-term range is $21.29 to $22.77.
Mixed divisional trends as revenue stalls and repurchases pause
Comcast reported flat pro forma revenue for Q3 2026, which limited headline growth and weighed on the overall performance narrative. The loss of 144,000 broadband subscribers and softer results in its theme park business contributed further pressure to core business segments. While Peacock achieved a second consecutive profitable quarter and record wireless customer additions, and the company declared a $0.33 quarterly dividend with a 5.8% yield, share repurchases have been paused since July 1, removing a source of support for the stock, according to Yahoo Finance. Operational results showed mixed trends across divisions, and a restructuring charge exceeding $1 billion is expected in Q4 as part of connectivity operations layoffs.
Sell signals dominate as MACD divergence emerges below resistance
On the technical side, CMCSA is trading below its MA-20 at $22.55 and the MA-50 at $22.2 on the hourly chart, and remains well below the longer-term MA-200 at $26.23 on the daily timeframe. The Ichimoku Kijun level at $22.44 provides immediate resistance overhead. Among momentum indicators, ADX signals a sell bias and RSI is at 41.84, both tilting conditions in favor of sellers, while CCI also reflects sell conditions. Stochastic RSI and Bull/Bear Power are in oversold territory, highlighting strong intraday selling. In contrast, MACD registers a strong buy signal, creating a divergence with other oscillators. The Awesome Oscillator remains neutral.
Bearish bias prevails as consolidation band limits upside
Over the coming sessions, CMCSA is expected to trade within a range of $21.29 to $22.77, reflecting the typical volatility band relative to current levels. The probability of a move higher stands at 38%, while a continuation lower is more likely at 62%. The baseline scenario calls for sideways consolidation within this band. A breakout above $22.44 would be needed for a bullish setup to emerge, whereas a break below $21.29 would confirm bearish momentum and open the risk of further downside.
Previously it was reported that strong earnings and operational momentum had shifted Comcast's technical outlook to a more positive stance. The current technical deterioration and pause in share buybacks signal a change in trend, with the $22.44 resistance now serving as a critical level to watch for any potential bullish reversal.











-
 Afghanistan
-
 Albania
-
 Algeria
-
 Angola
-
 Argentina
-
 Armenia
-
 Australia
-
 Austria
-
 Azerbaijan
-
 Bahamas
-
 Bahrain
-
 Bangladesh
-
 Belarus
-
 Belgium
-
 Bolivia
-
 Botswana
-
 Brazil
-
 Brunei
-
 Bulgaria
-
 Cambodia
-
 Cameroon
-
 Canada
-
 Chile
-
 China
-
 Colombia
-
 Congo
-
 Costa Rica
-
 Cote d'Ivoire
-
 Croatia
-
 Cuba
-
 Cyprus
-
 Czechia
-
 DR Congo
-
 Denmark
-
 Dominican Republic
-
 Ecuador
-
 Egypt
-
 El Salvador
-
 Estonia
-
 Eswatini
-
 Ethiopia
-
 Finland
-
 France
-
 Georgia
-
 Germany
-
 Ghana
-
 Greece
-
 Haiti
-
 Hong Kong
-
 Hungary
-
 India
-
 Indonesia
-
 Iran, Islamic republic
-
 Iraq
-
 Ireland
-
 Israel
-
 Italy
-
 Jamaica
-
 Japan
-
 Jordan
-
 Kazakhstan
-
 Kenya
-
 Korea
-
 Kuwait
-
 Kyrgyzstan
-
 Laos
-
 Latvia
-
 Lebanon
-
 Lesotho
-
 Libya
-
 Lithuania
-
 Luxembourg
-
 Madagascar
-
 Malaysia
-
 Malta
-
 Mauritius
-
 Mexico
-
 Moldova
-
 Mongolia
-
 Montenegro
-
 Morocco
-
 Mozambique
-
 Myanmar
-
 Namibia
-
 Nepal
-
 Netherlands
-
 New Zealand
-
 Nigeria
-
 North Macedonia
-
 Norway
-
 Oman
-
 Pakistan
-
 Palestine
-
 Panama
-
 Papua New Guinea
-
 Paraguay
-
 Peru
-
 Philippines
-
 Poland
-
 Portugal
-
 Puerto Rico
-
 Qatar
-
 Reunion
-
 Romania
-
 Rwanda
-
 Saudi Arabia
-
 Serbia
-
 Singapore
-
 Slovakia
-
 Slovenia
-
 Somalia
-
 South Africa
-
 Spain
-
 Sri Lanka
-
 Sweden
-
 Switzerland
-
 Syria
-
 Taiwan
-
 Tajikistan
-
 Tanzania
-
 Thailand
-
 Trinidad and Tobago
-
 Tunisia
-
 Turkey
-
 UAE
-
 Uganda
-
 Ukraine
-
 United Kingdom
-
United States
-
 Uruguay
-
 Uzbekistan
-
 Venezuela
-
 Vietnam
-
 Yemen
-
 Zambia
-
 Zimbabwe
- Forex
- Crypto












