


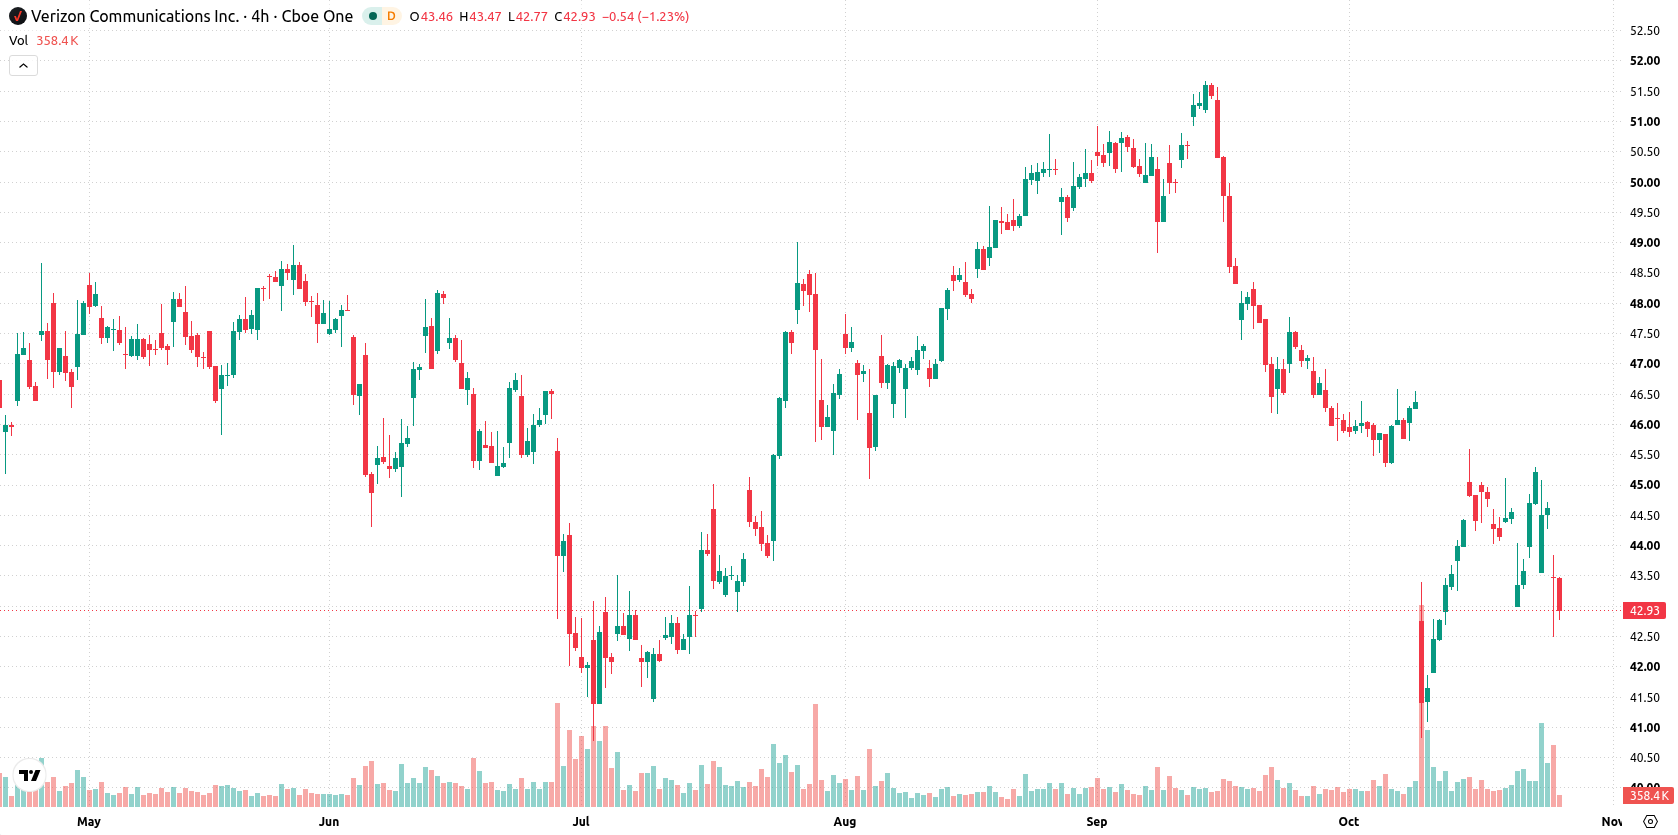
Verizon Communications Inc. (VZ) fell 3.91% after a gap-down open, with heavy selling pressure dominating the session even as the company posted strong third-quarter subscriber gains and raised its full-year guidance. The move is reinforced by Verizon’s price trading below its 20-, 50-, and 200-day moving averages, signaling broad technical weakness that supports the downside break.
 44.46
45.04
Highlights
- Verizon added 406,000 postpaid phone subscribers in the third quarter of 2026, posting its strongest net additions in five years.
- Quarterly revenue rose 1.5% to $34.31 billion, non-GAAP EPS of $1.31 beat consensus, and full-year subscriber guidance was raised.
- Verizon stock dropped 3.91% to $42.87, trading below key moving averages with bearish momentum and a projected five-day range of $41.75 to $44.42.
Earnings beat and guidance raise offset by persistent selling pressure
Verizon reported strong third-quarter 2026 results, adding 406,000 postpaid phone subscribers and delivering its best net additions in five years. Quarterly revenue increased 1.5% year over year to $34.31 billion, although this missed analyst expectations, but non-GAAP earnings per share of $1.31 surpassed consensus. The company raised its full-year 2026 guidance for postpaid phone subscriber additions and announced a multi-billion dollar AI infrastructure partnership with Amazon Web Services. Through the first nine months of 2026, Verizon returned $12.8 billion to shareholders via dividends and share repurchases, though price action has remained under broader selling pressure.
Bearish momentum prevails as resistance and sell signals converge
Verizon trades below its 20-day ($44.89), 50-day ($47.53), and 200-day ($46.72) moving averages, reflecting multi-timeframe bearish momentum. The nearest resistance is set at $43.05 and support at $41.75. All major momentum indicators remain negative, with MACD and ADX showing strong sell signals. RSI is at 45.13, also suggesting a sell bias, though the Stochastic RSI is overbought at 89.41 and CCI is neutral. Bull/Bear Power is marginally positive at 0.36, indicating slight intraday buyer strength, but the dominant signals point to continued pressure. Recent price action saw a pronounced gap lower and low intraday volatility, with divergence between overbought oscillators and bearish momentum structure.
Earlier, analysts noted that persistent technical weakness and sector competition were keeping downside risks elevated for Verizon shares. The latest price action, marked by a sharp gap lower despite positive subscriber and earnings data, reinforces this cautious view and highlights $41.75 as a key support level to monitor for further downside risk.









-
 Afghanistan
-
 Albania
-
 Algeria
-
 Angola
-
 Argentina
-
 Armenia
-
 Australia
-
 Austria
-
 Azerbaijan
-
 Bahamas
-
 Bahrain
-
 Bangladesh
-
 Belarus
-
 Belgium
-
 Bolivia
-
 Botswana
-
 Brazil
-
 Brunei
-
 Bulgaria
-
 Cambodia
-
 Cameroon
-
 Canada
-
 Chile
-
 China
-
 Colombia
-
 Congo
-
 Costa Rica
-
 Cote d'Ivoire
-
 Croatia
-
 Cuba
-
 Cyprus
-
 Czechia
-
 DR Congo
-
 Denmark
-
 Dominican Republic
-
 Ecuador
-
 Egypt
-
 El Salvador
-
 Estonia
-
 Eswatini
-
 Ethiopia
-
 Finland
-
 France
-
 Georgia
-
 Germany
-
 Ghana
-
 Greece
-
 Haiti
-
 Hong Kong
-
 Hungary
-
 India
-
 Indonesia
-
 Iran, Islamic republic
-
 Iraq
-
 Ireland
-
 Israel
-
 Italy
-
 Jamaica
-
 Japan
-
 Jordan
-
 Kazakhstan
-
 Kenya
-
 Korea
-
 Kuwait
-
 Kyrgyzstan
-
 Laos
-
 Latvia
-
 Lebanon
-
 Lesotho
-
 Libya
-
 Lithuania
-
 Luxembourg
-
 Madagascar
-
 Malaysia
-
 Malta
-
 Mauritius
-
 Mexico
-
 Moldova
-
 Mongolia
-
 Montenegro
-
 Morocco
-
 Mozambique
-
 Myanmar
-
 Namibia
-
 Nepal
-
 Netherlands
-
 New Zealand
-
 Nigeria
-
 North Macedonia
-
 Norway
-
 Oman
-
 Pakistan
-
 Palestine
-
 Panama
-
 Papua New Guinea
-
 Paraguay
-
 Peru
-
 Philippines
-
 Poland
-
 Portugal
-
 Puerto Rico
-
 Qatar
-
 Reunion
-
 Romania
-
 Rwanda
-
 Saudi Arabia
-
 Serbia
-
 Singapore
-
 Slovakia
-
 Slovenia
-
 Somalia
-
 South Africa
-
 Spain
-
 Sri Lanka
-
 Sweden
-
 Switzerland
-
 Syria
-
 Taiwan
-
 Tajikistan
-
 Tanzania
-
 Thailand
-
 Trinidad and Tobago
-
 Tunisia
-
 Turkey
-
 UAE
-
 Uganda
-
 Ukraine
-
 United Kingdom
-
United States
-
 Uruguay
-
 Uzbekistan
-
 Venezuela
-
 Vietnam
-
 Yemen
-
 Zambia
-
 Zimbabwe
- Forex
- Crypto












