

Verizon stock weekly forecast: Bearish setup persists amid low advance probability and oversold technical indicators

Shares of Verizon Communications Inc. (VZ) are trading near $44.4 as sellers continue to dominate, keeping the setup deep in oversold territory. The coming week opens with bearish momentum intact, as investors look for fresh catalysts to shift the tone.
 45.16
45.16
Highlights
- Shares of Verizon closed at $44.4, slipping slightly over the past week and remaining below key moving averages.
- Technical momentum is firmly negative, with daily indicators showing strong downside pressure and a persistent bearish structure.
- Price action is seen within a $42.75 to $45.28 range for the next five days, with $43.05 as key support and $45.03 as resistance.
Regulatory action and 6G milestone shape sentiment ahead of earnings release
Verizon is set to report its third-quarter earnings before the market opens on October 26, with earnings per share projected at $1.27 according to Yahoo Finance and The Globe and Mail. In the regulatory arena, Verizon and other issuers have formally objected to unauthorized tokenized trading of their shares on the OKX-ICE platform, prompting SEC-backed action to block the listings as reported by Yahoo Finance and CoinDesk. Additionally, Verizon and Ericsson recently completed what they describe as the first pre-standard 6G outdoor field call in the 7 GHz band, which Simply Wall St News highlights as a step forward for future technology initiatives.
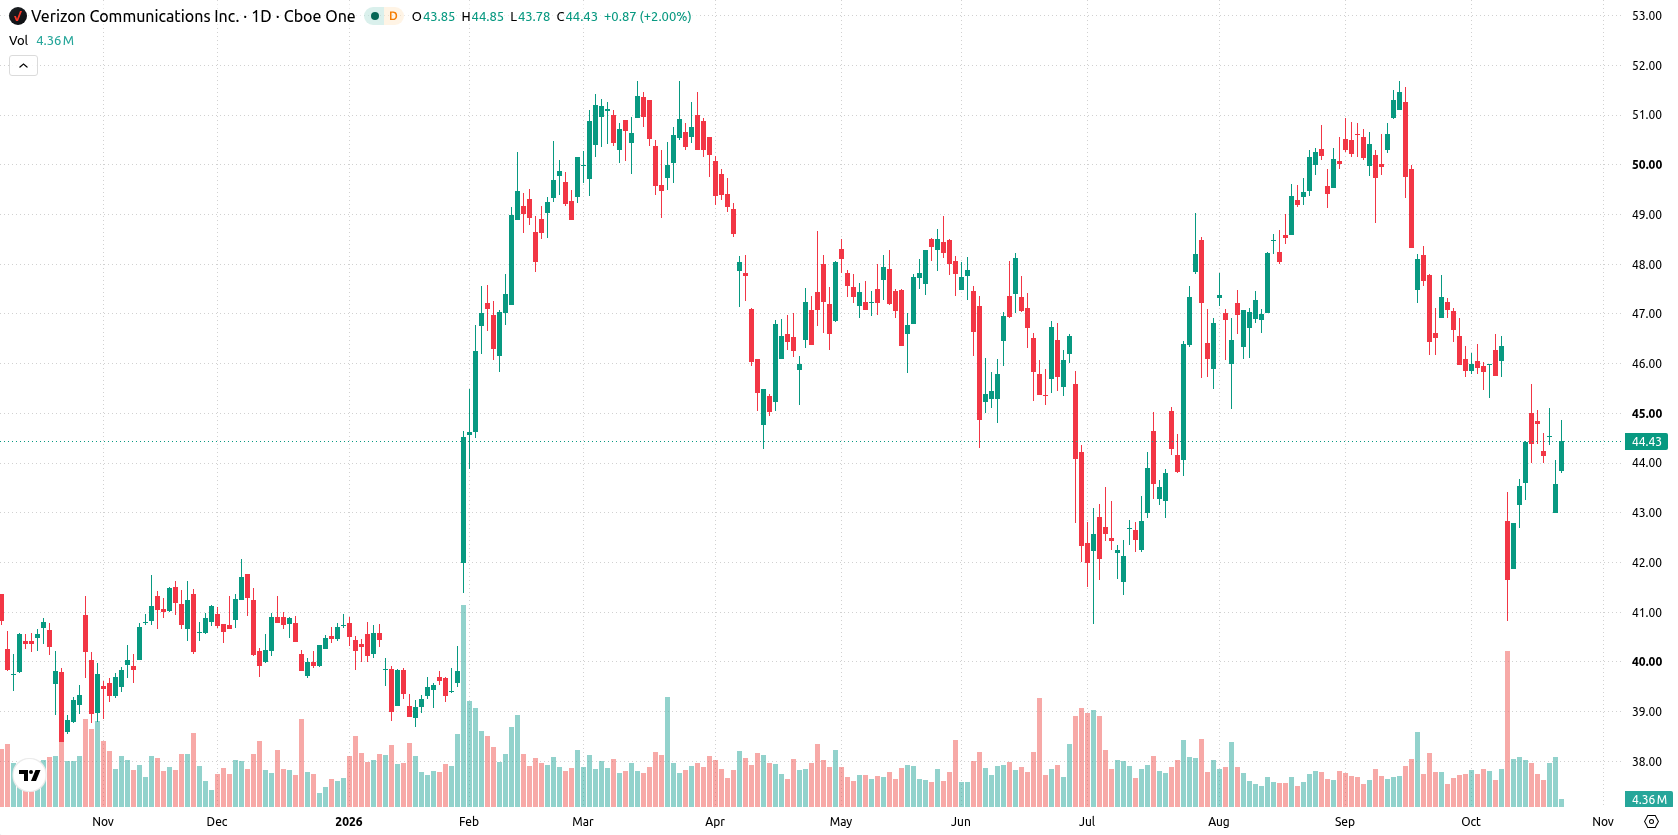
Downside momentum strengthens as MACD and ADX confirm weekly weakness
The daily chart shows a sustained move lower with a firm trend, supported by a negative MACD reading of -1.27 and an ADX of 31.31 indicating strong downside momentum. Both the RSI (38.21) and CCI (-89.1) are approaching oversold, which may temper further declines but have yet to trigger a reversal. The nearest support sits at $43.05, while resistance is marked at $45.03, with the Ichimoku Kijun at $46.17 also acting as a barrier. Although volatility over the past week was 4.6%, daily momentum remains consistently weak.
Pressure likely to persist with downside risks below key support next week
For the next five trading days, the expected range is $42.75 to $45.28. There is a very high probability of a decrease and a very low probability of an advance, setting the base case as continued pressure within this range. A bullish turn above $45.03 would challenge the local downtrend, while a decisive break below $43.05 would open the door to further losses toward the lower end of the forecast range.
Earlier, analysts noted that persistent technical weakness and sector competition were keeping downside risks elevated for Verizon shares. The current environment not only confirms this cautious outlook with continued bearish momentum but also introduces additional regulatory uncertainties, making the $43.05 support level crucial to monitor in the days ahead.






Latest Verizon News



-
 Afghanistan
-
 Albania
-
 Algeria
-
 Angola
-
 Argentina
-
 Armenia
-
 Australia
-
 Austria
-
 Azerbaijan
-
 Bahamas
-
 Bahrain
-
 Bangladesh
-
 Belarus
-
 Belgium
-
 Bolivia
-
 Botswana
-
 Brazil
-
 Brunei
-
 Bulgaria
-
 Cambodia
-
 Cameroon
-
 Canada
-
 Chile
-
 China
-
 Colombia
-
 Congo
-
 Costa Rica
-
 Cote d'Ivoire
-
 Croatia
-
 Cuba
-
 Cyprus
-
 Czechia
-
 DR Congo
-
 Denmark
-
 Dominican Republic
-
 Ecuador
-
 Egypt
-
 El Salvador
-
 Estonia
-
 Eswatini
-
 Ethiopia
-
 Finland
-
 France
-
 Georgia
-
 Germany
-
 Ghana
-
 Greece
-
 Haiti
-
 Hong Kong
-
 Hungary
-
 India
-
 Indonesia
-
 Iran, Islamic republic
-
 Iraq
-
 Ireland
-
 Israel
-
 Italy
-
 Jamaica
-
 Japan
-
 Jordan
-
 Kazakhstan
-
 Kenya
-
 Korea
-
 Kuwait
-
 Kyrgyzstan
-
 Laos
-
 Latvia
-
 Lebanon
-
 Lesotho
-
 Libya
-
 Lithuania
-
 Luxembourg
-
 Madagascar
-
 Malaysia
-
 Malta
-
 Mauritius
-
 Mexico
-
 Moldova
-
 Mongolia
-
 Montenegro
-
 Morocco
-
 Mozambique
-
 Myanmar
-
 Namibia
-
 Nepal
-
 Netherlands
-
 New Zealand
-
 Nigeria
-
 North Macedonia
-
 Norway
-
 Oman
-
 Pakistan
-
 Palestine
-
 Panama
-
 Papua New Guinea
-
 Paraguay
-
 Peru
-
 Philippines
-
 Poland
-
 Portugal
-
 Puerto Rico
-
 Qatar
-
 Reunion
-
 Romania
-
 Rwanda
-
 Saudi Arabia
-
 Serbia
-
 Singapore
-
 Slovakia
-
 Slovenia
-
 Somalia
-
 South Africa
-
 Spain
-
 Sri Lanka
-
 Sweden
-
 Switzerland
-
 Syria
-
 Taiwan
-
 Tajikistan
-
 Tanzania
-
 Thailand
-
 Trinidad and Tobago
-
 Tunisia
-
 Turkey
-
 UAE
-
 Uganda
-
 Ukraine
-
 United Kingdom
-
United States
-
 Uruguay
-
 Uzbekistan
-
 Venezuela
-
 Vietnam
-
 Yemen
-
 Zambia
-
 Zimbabwe
- Forex
- Crypto












