

Reckitt Benckiser trims outlook on manufacturing constraints: RKT remains under pressure

Reckitt Benckiser (RKT) stock is trading at GBX5,248, down 4.3% on the day. The price is positioned below its short- and medium-term moving averages but remains above its longer-term average.
 5450.00
5568.00
Highlights
- Reckitt Benckiser cut its 2026 core net revenue growth forecast to 3.5% to 4.5% due to manufacturing and demand challenges.
- The company posted third-quarter 2026 revenue growth of 3.3% for core operations and maintained its adjusted operating margin target.
- Shares of Reckitt Benckiser are under short- and medium-term selling pressure, with a projected range of GBX5,162 to GBX5,333 and momentum signals favoring continued downside.
Guidance cut reflects supply limits and weak China demand
Reckitt Benckiser Group PLC cut its full-year 2026 Core Reckitt like-for-like net revenue growth guidance to a range of 3.5% to 4.5%, citing manufacturing constraints on Lysol in North America and slower growth in the vitamins, minerals and supplements category in China. This adjustment points to headwinds in both supply and demand, which are expected to weigh on company performance in the near term. The group reported third-quarter 2026 revenue growth of 3.3% for Core Reckitt and 3.2% for the total group, and it maintained its 2026 adjusted operating margin target according to Investegate Co. Reckitt also initiated a £500 million share buyback in August 2026, with £90 million completed by October 23, though price action has remained under broader selling pressure.
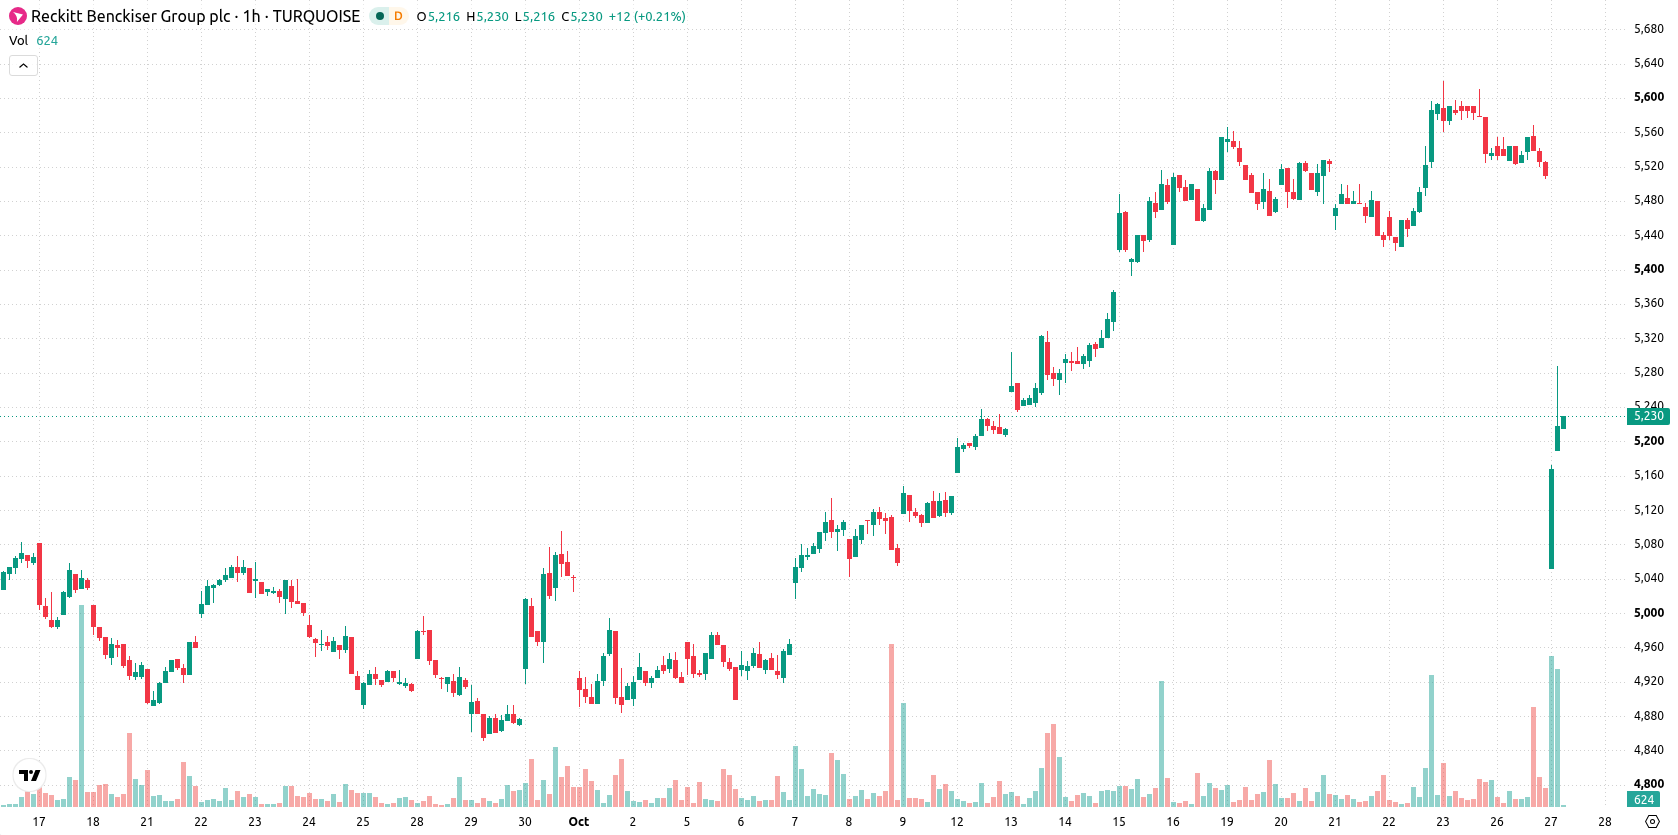
Momentum tilts bearish as price tests technical support
On the H1 chart, RKT is trading below the MA-20 at GBX5,520 and MA-50 at GBX5,501, while holding above the long-term MA-200 at GBX5,237 (daily). The immediate resistance is set by the Ichimoku Kijun level at GBX5,364. Momentum indicators such as MACD and ADX signal a Sell, while RSI, CCI, and Bull/Bear Power highlight oversold conditions and strong selling activity. Stoch RSI, however, points to a potential short-term rebound and Awesome Oscillator remains neutral.
Downside risk prevails amid volatility and key breakout levels
In the coming days, the expected price range is between GBX5,162 and GBX5,333, reflecting a typical volatility band relative to current levels. A baseline scenario suggests price will consolidate within this band. There is a 70% probability of continued downward movement and a 30% chance of an upward rebound. A sustained breakout above resistance at GBX5,364 could support a recovery, while a breach below support at GBX5,162 would reinforce further downside risk.
Earlier, analysts noted that Reckitt's downgraded sales guidance reflected ongoing challenges in key markets such as North America and China, amid supply constraints and softer consumer demand. The current technical setup suggests traders should monitor the GBX5,364 resistance level closely, as a sustained move above this threshold could shift momentum and signal the potential for an upside recovery.










-
 Afghanistan
-
 Albania
-
 Algeria
-
 Angola
-
 Argentina
-
 Armenia
-
 Australia
-
 Austria
-
 Azerbaijan
-
 Bahamas
-
 Bahrain
-
 Bangladesh
-
 Belarus
-
 Belgium
-
 Bolivia
-
 Botswana
-
 Brazil
-
 Brunei
-
 Bulgaria
-
 Cambodia
-
 Cameroon
-
 Canada
-
 Chile
-
 China
-
 Colombia
-
 Congo
-
 Costa Rica
-
 Cote d'Ivoire
-
 Croatia
-
 Cuba
-
 Cyprus
-
 Czechia
-
 DR Congo
-
 Denmark
-
 Dominican Republic
-
 Ecuador
-
 Egypt
-
 El Salvador
-
 Estonia
-
 Eswatini
-
 Ethiopia
-
 Finland
-
 France
-
 Georgia
-
 Germany
-
 Ghana
-
 Greece
-
 Haiti
-
 Hong Kong
-
 Hungary
-
 India
-
 Indonesia
-
 Iran, Islamic republic
-
 Iraq
-
 Ireland
-
 Israel
-
 Italy
-
 Jamaica
-
 Japan
-
 Jordan
-
 Kazakhstan
-
 Kenya
-
 Korea
-
 Kuwait
-
 Kyrgyzstan
-
 Laos
-
 Latvia
-
 Lebanon
-
 Lesotho
-
 Libya
-
 Lithuania
-
 Luxembourg
-
 Madagascar
-
 Malaysia
-
 Malta
-
 Mauritius
-
 Mexico
-
 Moldova
-
 Mongolia
-
 Montenegro
-
 Morocco
-
 Mozambique
-
 Myanmar
-
 Namibia
-
 Nepal
-
 Netherlands
-
 New Zealand
-
 Nigeria
-
 North Macedonia
-
 Norway
-
 Oman
-
 Pakistan
-
 Palestine
-
 Panama
-
 Papua New Guinea
-
 Paraguay
-
 Peru
-
 Philippines
-
 Poland
-
 Portugal
-
 Puerto Rico
-
 Qatar
-
 Reunion
-
 Romania
-
 Rwanda
-
 Saudi Arabia
-
 Serbia
-
 Singapore
-
 Slovakia
-
 Slovenia
-
 Somalia
-
 South Africa
-
 Spain
-
 Sri Lanka
-
 Sweden
-
 Switzerland
-
 Syria
-
 Taiwan
-
 Tajikistan
-
 Tanzania
-
 Thailand
-
 Trinidad and Tobago
-
 Tunisia
-
 Turkey
-
 UAE
-
 Uganda
-
 Ukraine
-
 United Kingdom
-
United States
-
 Uruguay
-
 Uzbekistan
-
 Venezuela
-
 Vietnam
-
 Yemen
-
 Zambia
-
 Zimbabwe
- Forex
- Crypto












