

IBM stock weekly forecast: Pullback risk grows as volatility picks up and buyers falter at resistance

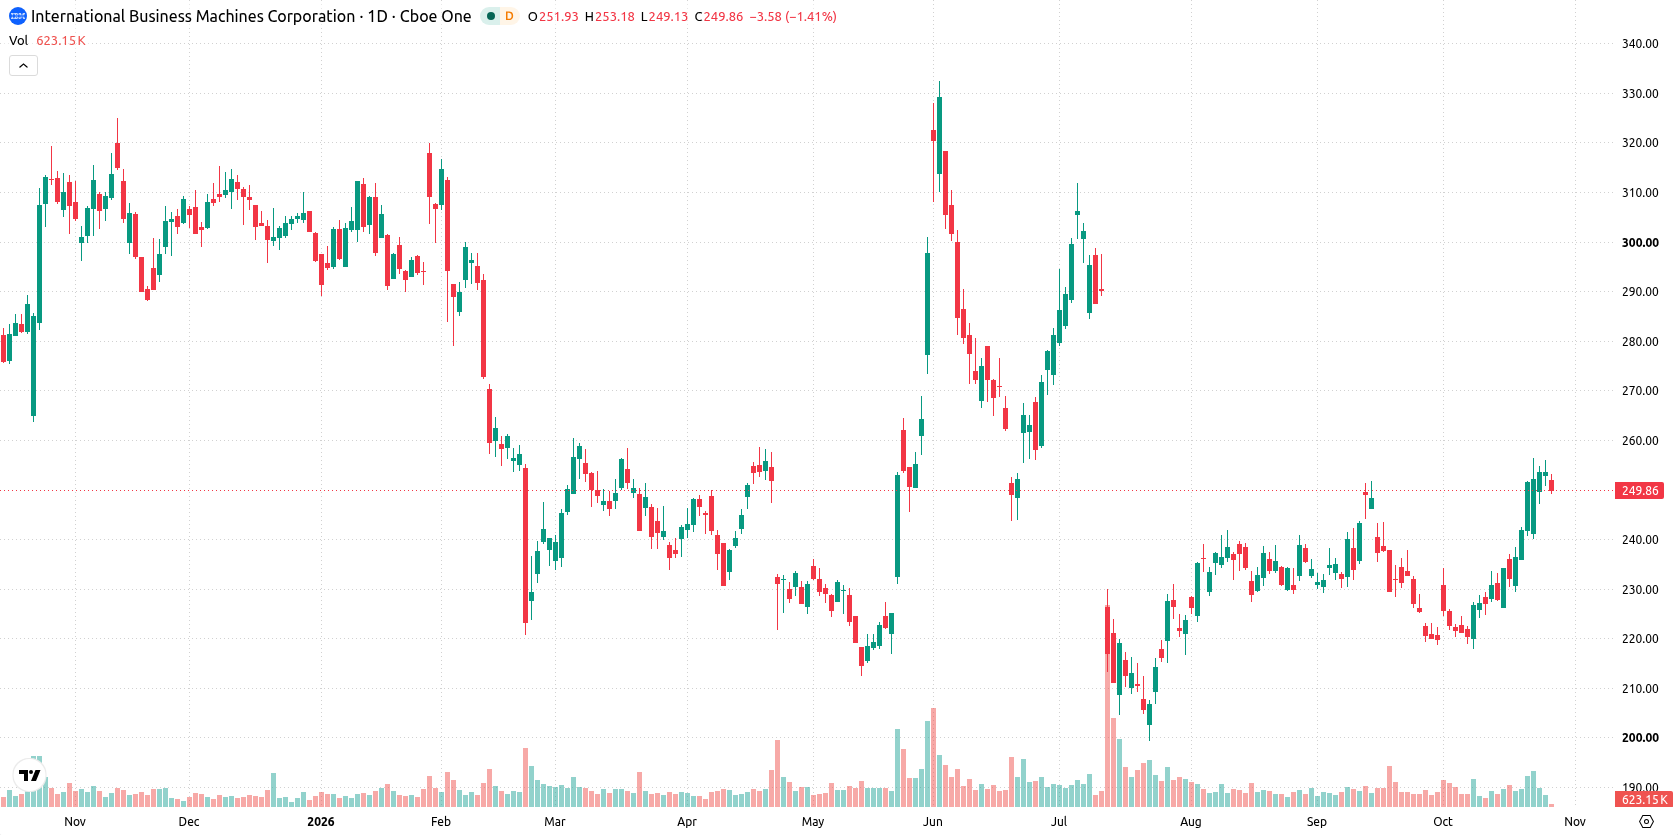
Shares of International Business Machines Corporation (IBM) are trading near $251 after a pullback of around 1% over the past week as buyers begin to show signs of fatigue. With momentum stretched and overbought signals flashing, attention turns to whether IBM can maintain recent support or faces a deeper correction heading into the new week.
 259.59
Highlights
- Shares of IBM declined 1.33% over the past week to $250.56, holding near key support at the 200-day moving average.
- Oscillators indicate overbought conditions, increasing the risk of a short-term pullback despite ongoing buying momentum from other indicators.
- Technical outlook projects a trading range of $243.68 to $257.43 in the next five days, with 76% probability of an increase.
Earnings optimism mixed with AI caution as guidance steadies sentiment
IBM reported third-quarter 2026 earnings with revenue of $17.1 billion and net income of $2.19 billion, reaffirming its full-year revenue growth guidance and regular dividend, according to PR Newswire. The software division drove a rebound, boosted by deals delayed from the previous quarter and recent acquisitions. Although earnings topped expectations, the CEO's comments on heightened corporate scrutiny of AI budgets and spending added a cautious note for the week ahead.
Overbought signals divergence as momentum holds near key support
On the daily chart, the setup reflects an emerging move lower that is not yet confirmed, with volatility over the past week at 6.39%. All three key oscillators — RSI at 70.86, CCI at 163.01, and Stochastic RSI at 98.93 — are in overbought territory, which raises the risk of a short-term pullback or correction. The MACD and ADX, however, continue to support buying momentum, creating a divergence with the overbought oscillator readings. Immediate support remains at the MA-200 ($250.21), with resistance defined by the recent weekly high at $256.
Near-term upside capped as overbought levels limit breakout potential
For the next five trading days, the expected range is $243.68 to $257.43, with a 76% probability of an increase and a 24% probability of a decrease. The base case sees IBM stock fluctuating between support at $250.21 and resistance at $256, with overbought conditions potentially limiting further near-term upside. A clear break above $256 would open the door for further gains within the projected range. Failure to hold $250.21 could see the stock pivot toward the lower bound of the expected range at $243.68.
Earlier, analysts noted that IBM’s trading was characterized by stretched technicals and neutral directional bias, with heightened focus on the potential for rangebound action or breakout risk around earnings. With the latest earnings beat now in focus and technicals still signaling overbought conditions, the immediate level to watch is support at the 200-day moving average, as a failure to hold could accelerate downside toward the lower end of the current trading range.






Latest IBM News





-
 Afghanistan
-
 Albania
-
 Algeria
-
 Angola
-
 Argentina
-
 Armenia
-
 Australia
-
 Austria
-
 Azerbaijan
-
 Bahamas
-
 Bahrain
-
 Bangladesh
-
 Belarus
-
 Belgium
-
 Bolivia
-
 Botswana
-
 Brazil
-
 Brunei
-
 Bulgaria
-
 Cambodia
-
 Cameroon
-
 Canada
-
 Chile
-
 China
-
 Colombia
-
 Congo
-
 Costa Rica
-
 Cote d'Ivoire
-
 Croatia
-
 Cuba
-
 Cyprus
-
 Czechia
-
 DR Congo
-
 Denmark
-
 Dominican Republic
-
 Ecuador
-
 Egypt
-
 El Salvador
-
 Estonia
-
 Eswatini
-
 Ethiopia
-
 Finland
-
 France
-
 Georgia
-
 Germany
-
 Ghana
-
 Greece
-
 Haiti
-
 Hong Kong
-
 Hungary
-
 India
-
 Indonesia
-
 Iran, Islamic republic
-
 Iraq
-
 Ireland
-
 Israel
-
 Italy
-
 Jamaica
-
 Japan
-
 Jordan
-
 Kazakhstan
-
 Kenya
-
 Korea
-
 Kuwait
-
 Kyrgyzstan
-
 Laos
-
 Latvia
-
 Lebanon
-
 Lesotho
-
 Libya
-
 Lithuania
-
 Luxembourg
-
 Madagascar
-
 Malaysia
-
 Malta
-
 Mauritius
-
 Mexico
-
 Moldova
-
 Mongolia
-
 Montenegro
-
 Morocco
-
 Mozambique
-
 Myanmar
-
 Namibia
-
 Nepal
-
 Netherlands
-
 New Zealand
-
 Nigeria
-
 North Macedonia
-
 Norway
-
 Oman
-
 Pakistan
-
 Palestine
-
 Panama
-
 Papua New Guinea
-
 Paraguay
-
 Peru
-
 Philippines
-
 Poland
-
 Portugal
-
 Puerto Rico
-
 Qatar
-
 Reunion
-
 Romania
-
 Rwanda
-
 Saudi Arabia
-
 Serbia
-
 Singapore
-
 Slovakia
-
 Slovenia
-
 Somalia
-
 South Africa
-
 Spain
-
 Sri Lanka
-
 Sweden
-
 Switzerland
-
 Syria
-
 Taiwan
-
 Tajikistan
-
 Tanzania
-
 Thailand
-
 Trinidad and Tobago
-
 Tunisia
-
 Turkey
-
 UAE
-
 Uganda
-
 Ukraine
-
 United Kingdom
-
United States
-
 Uruguay
-
 Uzbekistan
-
 Venezuela
-
 Vietnam
-
 Yemen
-
 Zambia
-
 Zimbabwe
- Forex
- Crypto












