

Shell stock outlook: Price vulnerable to further losses if selling persists

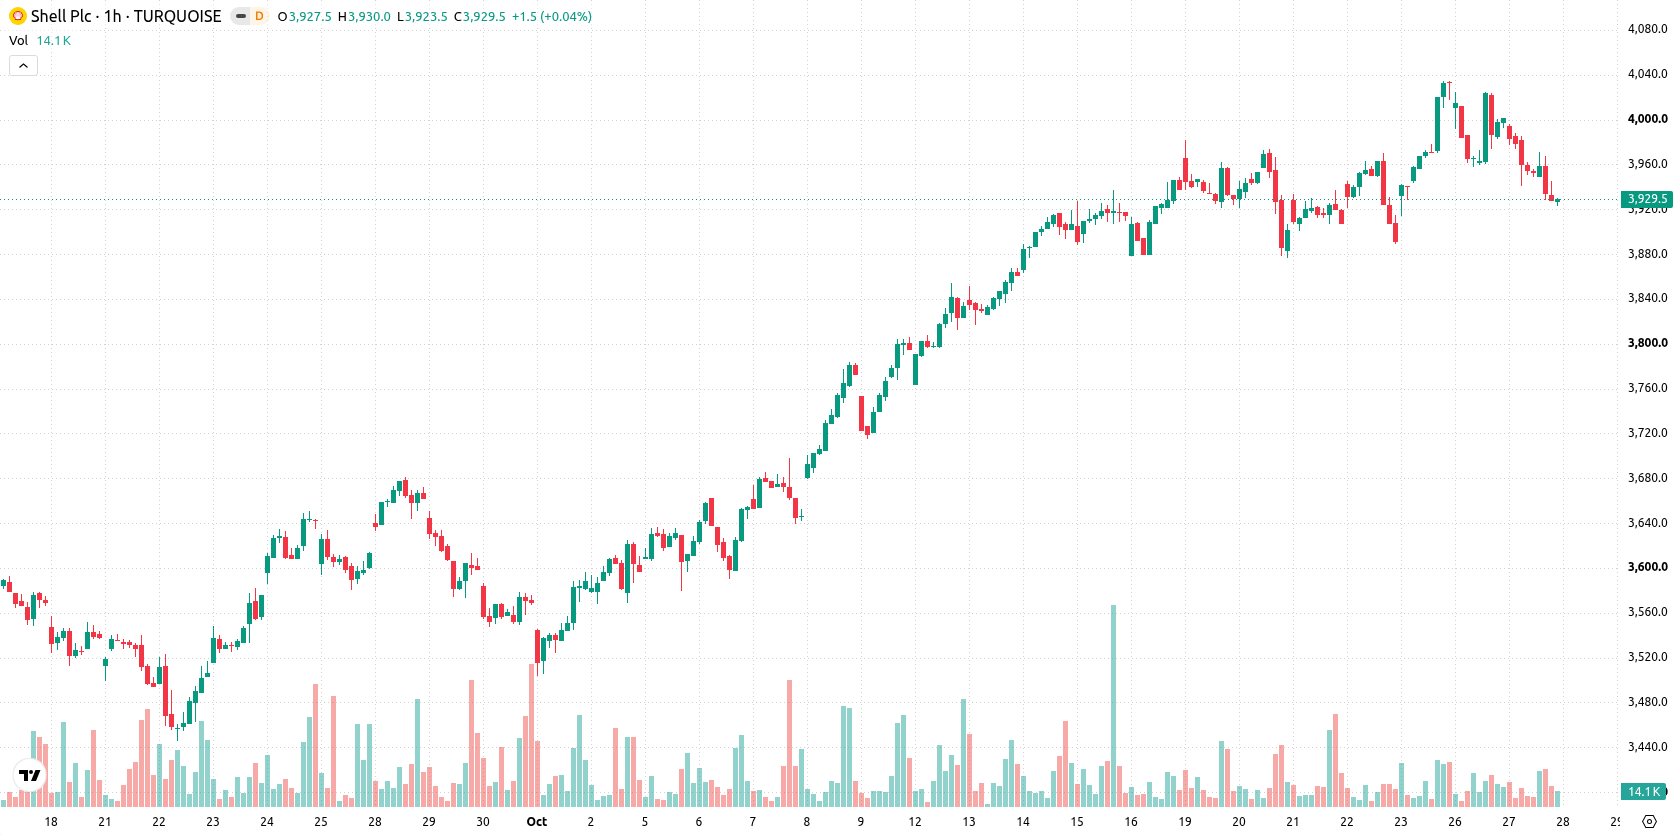
Shell (SHEL) stock is trading at GBX3,930, marking a daily decline of 1.73%. The price sits below its key short- and medium-term moving averages, but remains above its long-term trend support.
 4075.00
4110.00
Highlights
- Shell stock faces short- and medium-term selling pressure, with price below key moving averages on the h1 timeframe.
- Momentum indicators remain negative and intraday selling persists, confirmed by oversold oscillators and a 1.73% price decline to GBX3,930.
- Near-term range is projected between GBX3,864 and GBX3,996, with a 55% probability of further downside versus 45% for upside.
Bearish momentum and resistance test as sellers control hour chart
On the h1 timeframe, SHEL trades below both its MA-20 (GBX3,977) and MA-50 (GBX3,952), underscoring ongoing selling pressure in the short and medium term. On the daily chart, the price remains well above the MA-200 (GBX3,258), which acts as a key long-term support zone. The Ichimoku Kijun at GBX3,979 serves as immediate resistance. Momentum signals are predominantly negative: both MACD and RSI (40.74, Sell) indicate a bearish bias, ADX sits neutral, while Stoch RSI, CCI, and Bull/Bear Power highlight oversold levels or sustained seller dominance. Awesome Oscillator readings further reinforce the downside pattern, and a low-volatility session with a 3.5-point opening gap saw price close near session lows.
Sideways bias as risk skews mildly toward further downside
Over the next several trading days, price action is likely to remain within the volatility band of GBX3,864 to GBX3,996. The probability of a downward move modestly outweighs a rebound (55% vs 45%). The primary scenario calls for sideways movement in this corridor; a close above the GBX3,979 resistance would open the way for a bullish attempt toward higher levels, while a drop below GBX3,864 support would signal further short-term downside.
Earlier, analysts noted Shell's strong technical momentum and constructive outlook supported by long-term initiatives and a share buyback program. Recent price action signals a shift toward short-term bearish pressure, making GBX3,864 a critical support level to monitor for further downside risk.











-
 Afghanistan
-
 Albania
-
 Algeria
-
 Angola
-
 Argentina
-
 Armenia
-
 Australia
-
 Austria
-
 Azerbaijan
-
 Bahamas
-
 Bahrain
-
 Bangladesh
-
 Belarus
-
 Belgium
-
 Bolivia
-
 Botswana
-
 Brazil
-
 Brunei
-
 Bulgaria
-
 Cambodia
-
 Cameroon
-
 Canada
-
 Chile
-
 China
-
 Colombia
-
 Congo
-
 Costa Rica
-
 Cote d'Ivoire
-
 Croatia
-
 Cuba
-
 Cyprus
-
 Czechia
-
 DR Congo
-
 Denmark
-
 Dominican Republic
-
 Ecuador
-
 Egypt
-
 El Salvador
-
 Estonia
-
 Eswatini
-
 Ethiopia
-
 Finland
-
 France
-
 Georgia
-
 Germany
-
 Ghana
-
 Greece
-
 Haiti
-
 Hong Kong
-
 Hungary
-
 India
-
 Indonesia
-
 Iran, Islamic republic
-
 Iraq
-
 Ireland
-
 Israel
-
 Italy
-
 Jamaica
-
 Japan
-
 Jordan
-
 Kazakhstan
-
 Kenya
-
 Korea
-
 Kuwait
-
 Kyrgyzstan
-
 Laos
-
 Latvia
-
 Lebanon
-
 Lesotho
-
 Libya
-
 Lithuania
-
 Luxembourg
-
 Madagascar
-
 Malaysia
-
 Malta
-
 Mauritius
-
 Mexico
-
 Moldova
-
 Mongolia
-
 Montenegro
-
 Morocco
-
 Mozambique
-
 Myanmar
-
 Namibia
-
 Nepal
-
 Netherlands
-
 New Zealand
-
 Nigeria
-
 North Macedonia
-
 Norway
-
 Oman
-
 Pakistan
-
 Palestine
-
 Panama
-
 Papua New Guinea
-
 Paraguay
-
 Peru
-
 Philippines
-
 Poland
-
 Portugal
-
 Puerto Rico
-
 Qatar
-
 Reunion
-
 Romania
-
 Rwanda
-
 Saudi Arabia
-
 Serbia
-
 Singapore
-
 Slovakia
-
 Slovenia
-
 Somalia
-
 South Africa
-
 Spain
-
 Sri Lanka
-
 Sweden
-
 Switzerland
-
 Syria
-
 Taiwan
-
 Tajikistan
-
 Tanzania
-
 Thailand
-
 Trinidad and Tobago
-
 Tunisia
-
 Turkey
-
 UAE
-
 Uganda
-
 Ukraine
-
 United Kingdom
-
United States
-
 Uruguay
-
 Uzbekistan
-
 Venezuela
-
 Vietnam
-
 Yemen
-
 Zambia
-
 Zimbabwe
- Forex
- Crypto












