

Robinhood stock extends downward price move as seller pressure dominates the session

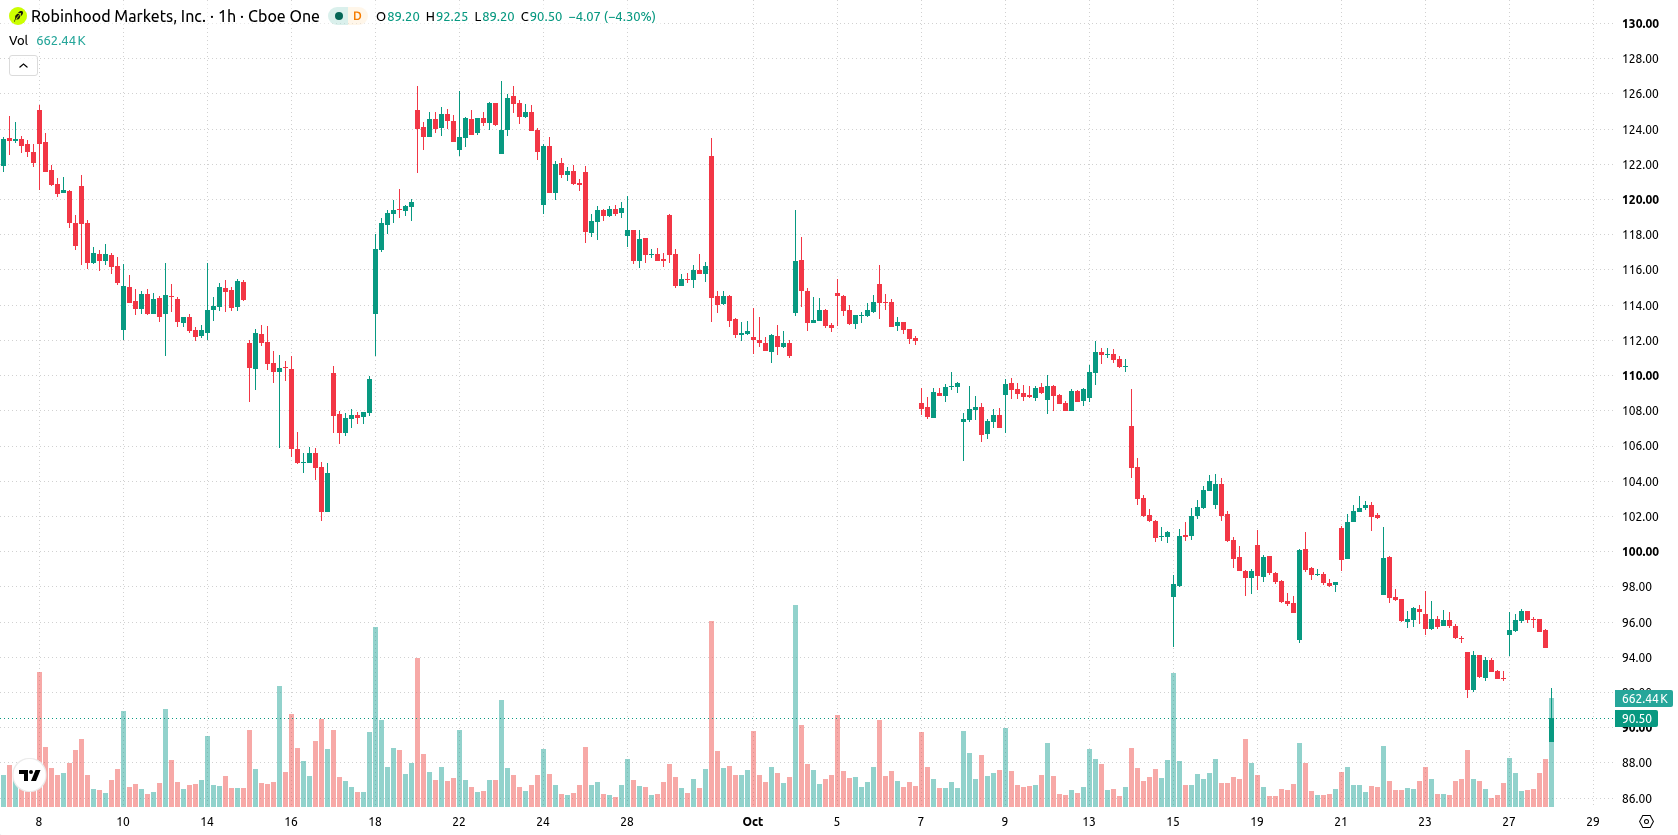
Robinhood (HOOD) stock is trading at $91.34, marking a daily drop of 3.52%. The price is positioned below its key moving averages, indicating sustained pressure and moderate intraday volatility.
 68.69
75.55
Highlights
- Robinhood posted record third-quarter 2026 revenue of $1.4 billion, up 12% year-over-year, with all-time-high transaction volumes in equities, options, and margin products.
- Cryptocurrency trading revenue fell 55% to $120 million and now accounts for just 8.4% of total revenue.
- Robinhood stock trades below key moving averages, momentum indicators are negative, and the expected price range is $87.13 to $95.55.
Revenue records fail to offset crypto slump as market reacts warily
Robinhood reported record third-quarter 2026 revenue of $1.4 billion, showing 12% year-over-year growth and all-time-high transaction volumes in equities, options, and margin products, according to Investors Robinhood. However, the company’s cryptocurrency trading revenue declined sharply by 55% year-over-year to $120 million, now representing just 8.4% of total revenue, as noted by FXStreet, which diminished the strength in other business segments. Additional highlights included Robinhood Chain generating over $50 million in fees on more than $80 billion in decentralized exchange volume, as reported by CoinDesk, and the company’s newly expanded partnership with Ripple aimed at integrating RLUSD for cash management and settlement, per TradingView, though investors responded with caution and shares declined following the earnings release.
Downward momentum persists as technical barriers reinforce weakness
On the technical front, HOOD is trading below its MA-20 and MA-50 on the H1 chart and also below its MA-200 on the daily timeframe, with the Ichimoku Kijun currently at $94.76 acting as immediate resistance. Momentum readings are broadly negative: MACD signals a strong sell, ADX confirms a prevailing selling trend, and RSI is in selling territory. Meanwhile, CCI and Stoch RSI remain neutral, Bull/Bear Power points to dominance by sellers in oversold conditions, and the Awesome Oscillator is neutral and not adding further downside momentum.
Limited rebound prospects as consolidation favors further downside
Looking ahead, the forecast for HOOD anticipates price action consolidating in the $87.13 to $95.55 band over the coming days. Probability of an upward breakout is very low given current technical momentum, while further downside remains highly likely if the price closes below the $87.13 support. A move above resistance at $94.76 would be required to signal a meaningful bullish reversal. Overall, price is expected to remain under pressure within this volatility band.
Previously it was reported that Robinhood's earnings lagged expectations due to a significant slump in cryptocurrency trading revenue, highlighting the company's vulnerability to downturns in volatile asset classes even amid broader business growth. The latest technical and fundamental signals confirm that the stock remains under pressure, with downside risk prevailing and the $87.13 support level serving as the next critical area for traders to monitor.






Latest Robinhood News




-
 Afghanistan
-
 Albania
-
 Algeria
-
 Angola
-
 Argentina
-
 Armenia
-
 Australia
-
 Austria
-
 Azerbaijan
-
 Bahamas
-
 Bahrain
-
 Bangladesh
-
 Belarus
-
 Belgium
-
 Bolivia
-
 Botswana
-
 Brazil
-
 Brunei
-
 Bulgaria
-
 Cambodia
-
 Cameroon
-
 Canada
-
 Chile
-
 China
-
 Colombia
-
 Congo
-
 Costa Rica
-
 Cote d'Ivoire
-
 Croatia
-
 Cuba
-
 Cyprus
-
 Czechia
-
 DR Congo
-
 Denmark
-
 Dominican Republic
-
 Ecuador
-
 Egypt
-
 El Salvador
-
 Estonia
-
 Eswatini
-
 Ethiopia
-
 Finland
-
 France
-
 Georgia
-
 Germany
-
 Ghana
-
 Greece
-
 Haiti
-
 Hong Kong
-
 Hungary
-
 India
-
 Indonesia
-
 Iran, Islamic republic
-
 Iraq
-
 Ireland
-
 Israel
-
 Italy
-
 Jamaica
-
 Japan
-
 Jordan
-
 Kazakhstan
-
 Kenya
-
 Korea
-
 Kuwait
-
 Kyrgyzstan
-
 Laos
-
 Latvia
-
 Lebanon
-
 Lesotho
-
 Libya
-
 Lithuania
-
 Luxembourg
-
 Madagascar
-
 Malaysia
-
 Malta
-
 Mauritius
-
 Mexico
-
 Moldova
-
 Mongolia
-
 Montenegro
-
 Morocco
-
 Mozambique
-
 Myanmar
-
 Namibia
-
 Nepal
-
 Netherlands
-
 New Zealand
-
 Nigeria
-
 North Macedonia
-
 Norway
-
 Oman
-
 Pakistan
-
 Palestine
-
 Panama
-
 Papua New Guinea
-
 Paraguay
-
 Peru
-
 Philippines
-
 Poland
-
 Portugal
-
 Puerto Rico
-
 Qatar
-
 Reunion
-
 Romania
-
 Rwanda
-
 Saudi Arabia
-
 Serbia
-
 Singapore
-
 Slovakia
-
 Slovenia
-
 Somalia
-
 South Africa
-
 Spain
-
 Sri Lanka
-
 Sweden
-
 Switzerland
-
 Syria
-
 Taiwan
-
 Tajikistan
-
 Tanzania
-
 Thailand
-
 Trinidad and Tobago
-
 Tunisia
-
 Turkey
-
 UAE
-
 Uganda
-
 Ukraine
-
 United Kingdom
-
United States
-
 Uruguay
-
 Uzbekistan
-
 Venezuela
-
 Vietnam
-
 Yemen
-
 Zambia
-
 Zimbabwe
- Forex
- Crypto












