

Robinhood stock slumps nearly 4% as technical selling pressure outweighs platform innovations

Robinhood Markets Inc (HOOD) slumped 3.66% after ongoing bearish momentum pressured the stock, even as recently introduced live IPO pricing tools and record deposit inflows provided a positive operational backdrop. The move is supported by HOOD trading below all major moving averages and failing to regain near-term resistance, confirming persistent selling pressure.
 68.67
75.55
Highlights
- Robinhood unveiled live IPO pricing tools and expanded retail access, distributing shares in high-profile offerings to over 850,000 users.
- The company posted record deposits at $68 billion and third-quarter 2026 revenue of $5.08 billion with a 19% rise in transaction-based revenue.
- Shares of Robinhood trade below key moving averages with downside momentum dominant and an expected price range of $61.99 to $70.29 over five days.
Record deposits and IPO access contrast with ongoing selling pressure
Robinhood launched new live IPO pricing tools coinciding with the headline Anthropic IPO on Nasdaq, which was accompanied by increased user engagement. The company also expanded retail customer access to IPO allocations, with over 850,000 users receiving shares in recent offerings such as SpaceX. Robinhood reported a record $68 billion in deposits and third-quarter 2026 revenue of $5.08 billion alongside a 19% year-over-year rise in transaction-based revenue, though price action has remained under broader selling pressure.
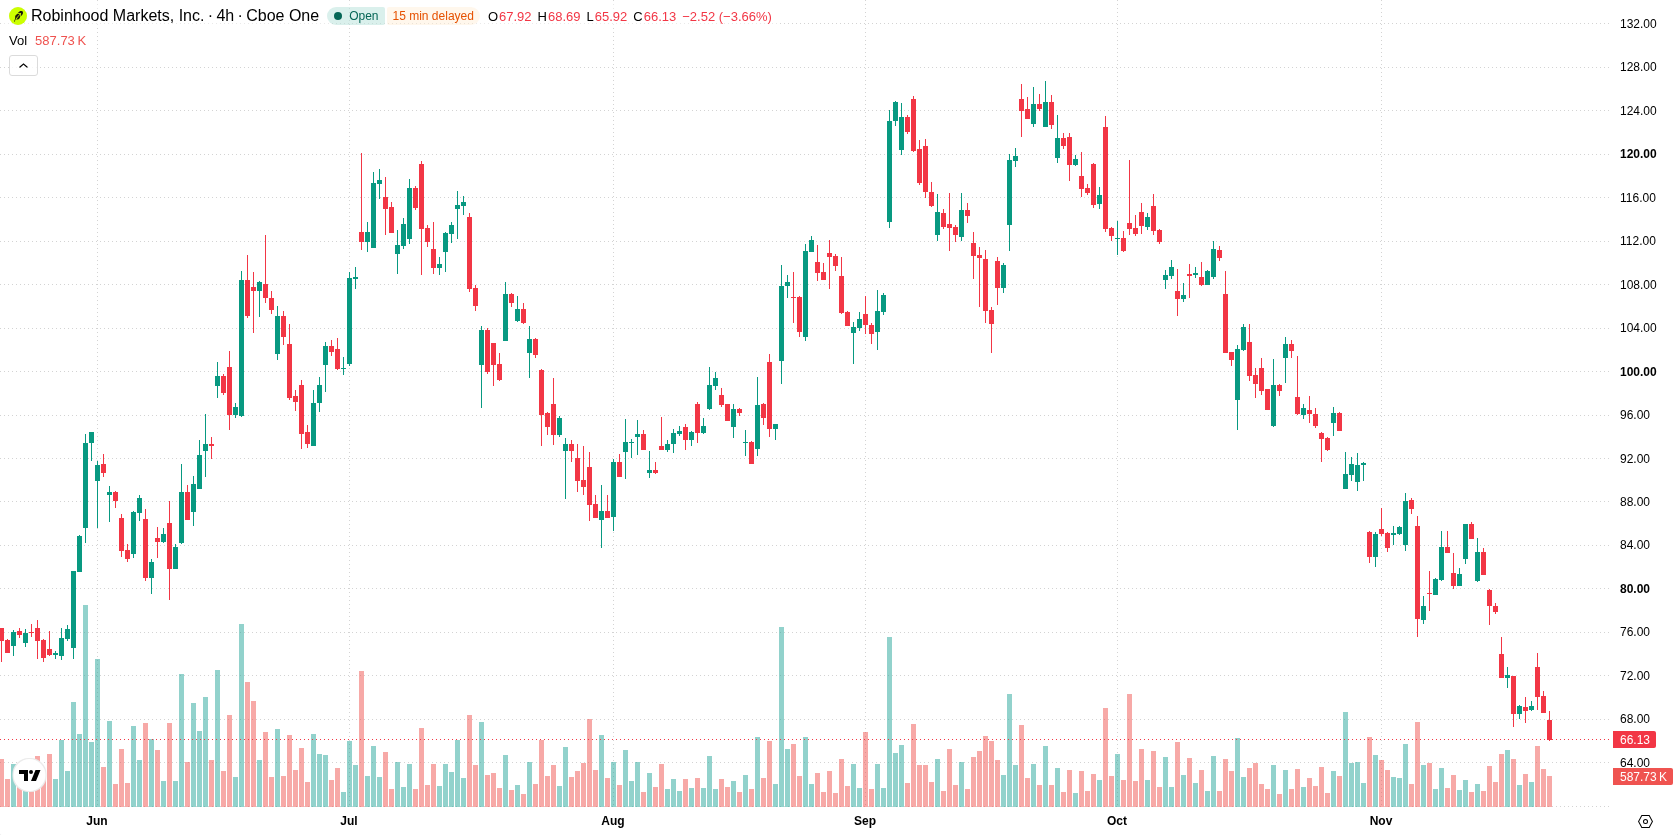
Oversold readings as technicals reflect dominant bearish momentum
Robinhood is trading below all major moving averages: the 20-day at $82.69, the 50-day at $99.47, and the 200-day at $91.02, signaling persistent downward pressure across short-, medium-, and long-term timeframes. The nearest resistance is the near-term ceiling at $67.25, while support is found at the near-term floor of $61.99. The MA-50 remains above the MA-200, maintaining a bullish long-term setup despite near-term weakness in price action. Momentum indicators highlight ongoing bearish sentiment, with the MACD at -10.3 and the Average Directional Index (ADX) at 33.71 indicating strong selling pressure. The Relative Strength Index (RSI) is in the oversold zone at 27.24, as are both the Stochastic RSI at 0 and the Commodity Channel Index (CCI) at -132.98, suggesting a potential for a technical rebound, though intraday dynamics remain dominated by sellers. The negative Bull/Bear Power (BBP) reading of -3.75 and a negative Awesome Oscillator (AO) further reinforce the prevailing bearish trend. The stock remains near the session low with intraday volatility at 7.96%, reflecting persistent weakness after the open.
Earlier, analysts noted that Robinhood faced ongoing downside pressure despite new product launches and policy changes designed to boost user engagement. The current analysis reinforces this bearish trend, highlighting strong selling pressure and suggesting that traders should monitor the $61.99 support level as a potential inflection point for further downside risk.






Latest Robinhood News




-
 Afghanistan
-
 Albania
-
 Algeria
-
 Angola
-
 Argentina
-
 Armenia
-
 Australia
-
 Austria
-
 Azerbaijan
-
 Bahamas
-
 Bahrain
-
 Bangladesh
-
 Belarus
-
 Belgium
-
 Bolivia
-
 Botswana
-
 Brazil
-
 Brunei
-
 Bulgaria
-
 Cambodia
-
 Cameroon
-
 Canada
-
 Chile
-
 China
-
 Colombia
-
 Congo
-
 Costa Rica
-
 Cote d'Ivoire
-
 Croatia
-
 Cuba
-
 Cyprus
-
 Czechia
-
 DR Congo
-
 Denmark
-
 Dominican Republic
-
 Ecuador
-
 Egypt
-
 El Salvador
-
 Estonia
-
 Eswatini
-
 Ethiopia
-
 Finland
-
 France
-
 Georgia
-
 Germany
-
 Ghana
-
 Greece
-
 Haiti
-
 Hong Kong
-
 Hungary
-
 India
-
 Indonesia
-
 Iran, Islamic republic
-
 Iraq
-
 Ireland
-
 Israel
-
 Italy
-
 Jamaica
-
 Japan
-
 Jordan
-
 Kazakhstan
-
 Kenya
-
 Korea
-
 Kuwait
-
 Kyrgyzstan
-
 Laos
-
 Latvia
-
 Lebanon
-
 Lesotho
-
 Libya
-
 Lithuania
-
 Luxembourg
-
 Madagascar
-
 Malaysia
-
 Malta
-
 Mauritius
-
 Mexico
-
 Moldova
-
 Mongolia
-
 Montenegro
-
 Morocco
-
 Mozambique
-
 Myanmar
-
 Namibia
-
 Nepal
-
 Netherlands
-
 New Zealand
-
 Nigeria
-
 North Macedonia
-
 Norway
-
 Oman
-
 Pakistan
-
 Palestine
-
 Panama
-
 Papua New Guinea
-
 Paraguay
-
 Peru
-
 Philippines
-
 Poland
-
 Portugal
-
 Puerto Rico
-
 Qatar
-
 Reunion
-
 Romania
-
 Rwanda
-
 Saudi Arabia
-
 Serbia
-
 Singapore
-
 Slovakia
-
 Slovenia
-
 Somalia
-
 South Africa
-
 Spain
-
 Sri Lanka
-
 Sweden
-
 Switzerland
-
 Syria
-
 Taiwan
-
 Tajikistan
-
 Tanzania
-
 Thailand
-
 Trinidad and Tobago
-
 Tunisia
-
 Turkey
-
 UAE
-
 Uganda
-
 Ukraine
-
 United Kingdom
-
United States
-
 Uruguay
-
 Uzbekistan
-
 Venezuela
-
 Vietnam
-
 Yemen
-
 Zambia
-
 Zimbabwe
- Forex
- Crypto












