

Robinhood stock declines as seller pressure dominates short-term trend

Robinhood (HOOD) stock is trading at $63.92, down 6.89% on the day, reflecting a sharp intraday decline. The price currently sits below its key moving averages, highlighting persistent selling pressure and technical weakness.
 68.67
75.55
Highlights
- Robinhood introduced live IPO pricing tools for the Anthropic listing, aiming to provide greater price transparency and engage retail investors.
- A shareholder proposal from As You Sow requests review of Robinhood's proxy-voting services ahead of the next annual meeting.
- Shares of Robinhood trade below major moving averages amid persistent selling pressure, with price expected to consolidate between $60.21 and $67.63.
Product innovation and governance debate reshape investor sentiment
Robinhood introduced new live IPO pricing tools timed with the public debut of Anthropic, a move intended to enhance price transparency and potentially attract greater participation from retail investors on its platform, according to Yahoo Finance. This recent product release could improve user engagement and increase trading volumes in future IPOs. Separately, a shareholder proposal from advocacy group As You Sow was submitted for review of Robinhood’s proxy-voting services, an action which may influence corporate governance at the next annual meeting. These developments have emerged against a backdrop of continued price weakness.
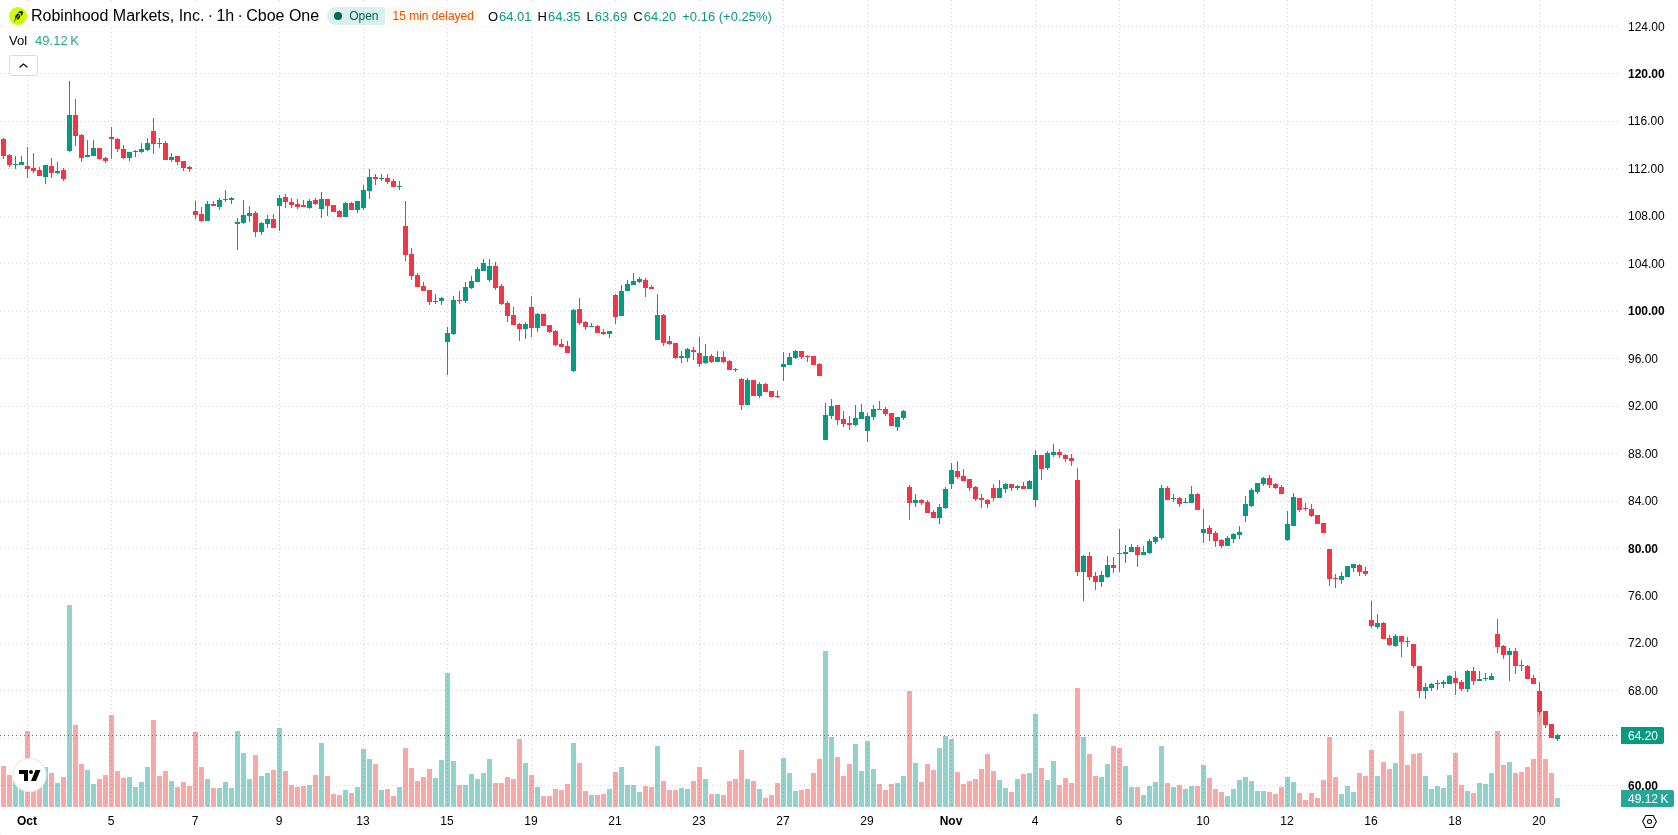
Sustained momentum loss as technical barriers reinforce bearish outlook
Technically, HOOD remains below the H1 SMA-20 at $69.05, the H1 SMA-50 at $74.64, and the D1 SMA-200 at $91.02. The Ichimoku Kijun level at $69.45 serves as immediate resistance. Momentum indicators reinforce the weak backdrop: both MACD and ADX are in Sell mode, while RSI, Stochastic RSI, and CCI are all oversold. Bearish dominance is confirmed by negative Bull/Bear Power at –2.53 and continued downward momentum in the Awesome Oscillator.
Downside risk dominates as limited upside triggers potential volatility
Over the next several trading sessions, HOOD is likely to fluctuate within a typical volatility band between $60.21 and $67.63. The probability of a move higher remains very low, while the probability of a fresh decline is high. The base case scenario is for sideways consolidation within this range. However, a break above the $69.45 resistance could prompt short-covering and a recovery attempt, while a drop below $60.21 would likely trigger further selling.
Earlier, analysts noted that Robinhood shares remained under persistent downward pressure despite product launches aimed at boosting user engagement. This analysis is reinforced by new technical data, suggesting traders should monitor the $60.21 support for a potential downside break that could trigger additional selling.






Latest Robinhood News




-
 Afghanistan
-
 Albania
-
 Algeria
-
 Angola
-
 Argentina
-
 Armenia
-
 Australia
-
 Austria
-
 Azerbaijan
-
 Bahamas
-
 Bahrain
-
 Bangladesh
-
 Belarus
-
 Belgium
-
 Bolivia
-
 Botswana
-
 Brazil
-
 Brunei
-
 Bulgaria
-
 Cambodia
-
 Cameroon
-
 Canada
-
 Chile
-
 China
-
 Colombia
-
 Congo
-
 Costa Rica
-
 Cote d'Ivoire
-
 Croatia
-
 Cuba
-
 Cyprus
-
 Czechia
-
 DR Congo
-
 Denmark
-
 Dominican Republic
-
 Ecuador
-
 Egypt
-
 El Salvador
-
 Estonia
-
 Eswatini
-
 Ethiopia
-
 Finland
-
 France
-
 Georgia
-
 Germany
-
 Ghana
-
 Greece
-
 Haiti
-
 Hong Kong
-
 Hungary
-
 India
-
 Indonesia
-
 Iran, Islamic republic
-
 Iraq
-
 Ireland
-
 Israel
-
 Italy
-
 Jamaica
-
 Japan
-
 Jordan
-
 Kazakhstan
-
 Kenya
-
 Korea
-
 Kuwait
-
 Kyrgyzstan
-
 Laos
-
 Latvia
-
 Lebanon
-
 Lesotho
-
 Libya
-
 Lithuania
-
 Luxembourg
-
 Madagascar
-
 Malaysia
-
 Malta
-
 Mauritius
-
 Mexico
-
 Moldova
-
 Mongolia
-
 Montenegro
-
 Morocco
-
 Mozambique
-
 Myanmar
-
 Namibia
-
 Nepal
-
 Netherlands
-
 New Zealand
-
 Nigeria
-
 North Macedonia
-
 Norway
-
 Oman
-
 Pakistan
-
 Palestine
-
 Panama
-
 Papua New Guinea
-
 Paraguay
-
 Peru
-
 Philippines
-
 Poland
-
 Portugal
-
 Puerto Rico
-
 Qatar
-
 Reunion
-
 Romania
-
 Rwanda
-
 Saudi Arabia
-
 Serbia
-
 Singapore
-
 Slovakia
-
 Slovenia
-
 Somalia
-
 South Africa
-
 Spain
-
 Sri Lanka
-
 Sweden
-
 Switzerland
-
 Syria
-
 Taiwan
-
 Tajikistan
-
 Tanzania
-
 Thailand
-
 Trinidad and Tobago
-
 Tunisia
-
 Turkey
-
 UAE
-
 Uganda
-
 Ukraine
-
 United Kingdom
-
United States
-
 Uruguay
-
 Uzbekistan
-
 Venezuela
-
 Vietnam
-
 Yemen
-
 Zambia
-
 Zimbabwe
- Forex
- Crypto












