

MSFT remains range-bound as buyers and sellers struggle for control

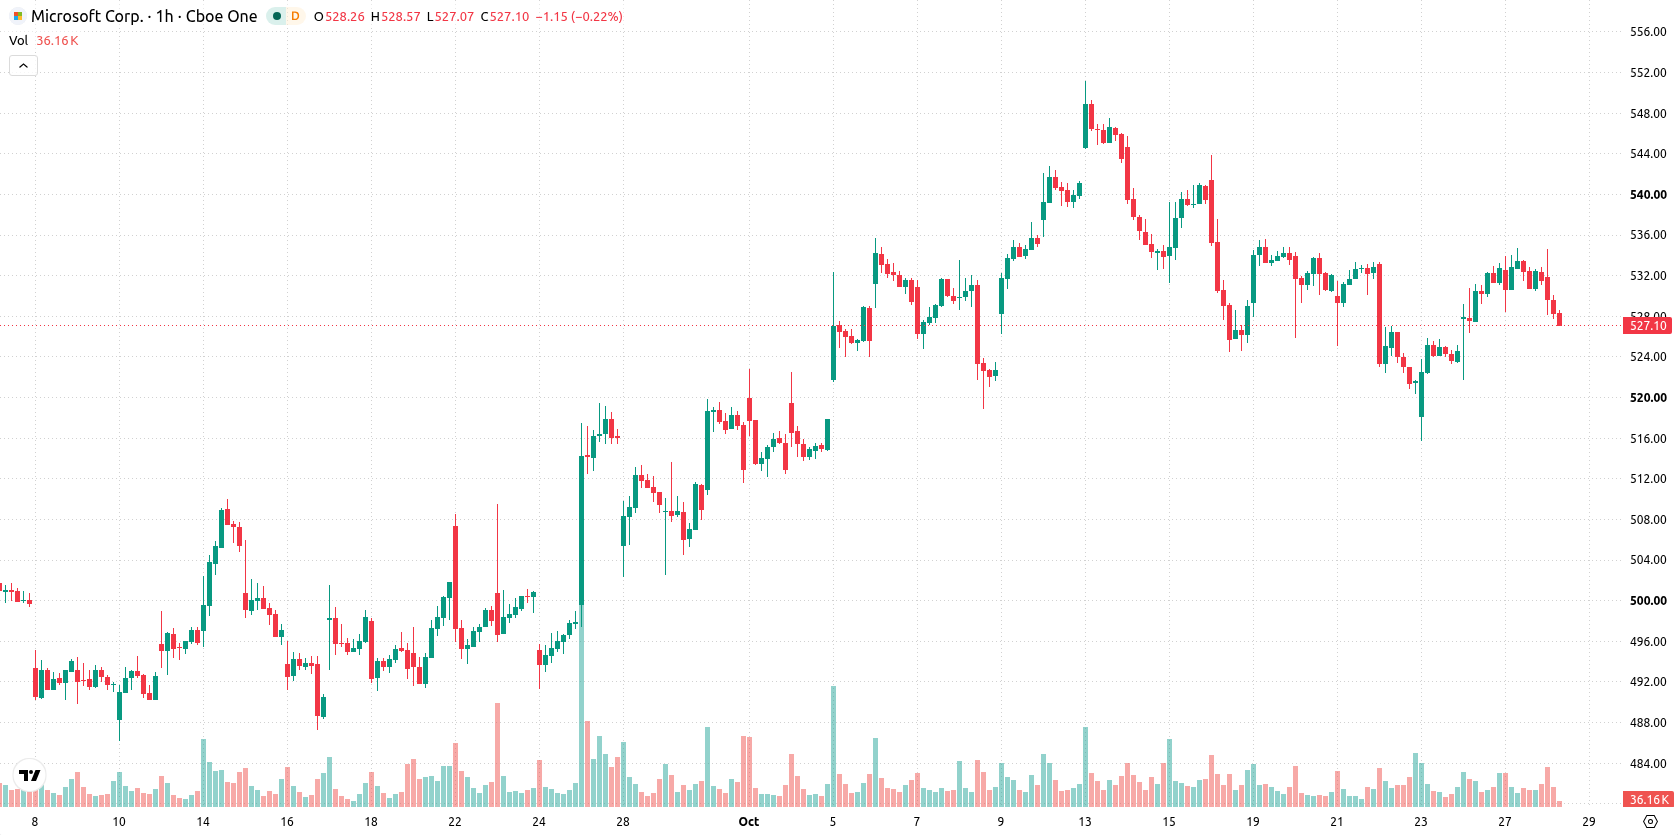
Microsoft (MSFT) stock is trading at $527.68, posting a modest decline for the session. The current price is positioned below its key moving averages and sits near today's low, reflecting ongoing pressure from sellers with moderate volatility.
 524.70
534.70
Highlights
- Microsoft offered voluntary buyouts to roughly 60,000 employees to manage costs as capital spending on AI and cloud grows.
- Microsoft raised its quarterly dividend by 8% to $0.98 per share, and Anthropic committed to $44.9 billion in Azure cloud spending.
- Shares of Microsoft fell 0.69% to $527.68 and are expected to trade in a $519.32 to $536.04 range with downside risk prevailing as technical indicators show ongoing seller dominance.
Voluntary buyouts and dividend hike offset AI investment strain
Microsoft has offered voluntary buyouts to roughly 60,000 employees in a move to manage costs as the company deepens investment in artificial intelligence and cloud infrastructure, according to 247wallst. This direct adjustment in operational expenses could help balance the financial impact of ongoing capital outlays. Additionally, Microsoft raised its quarterly dividend by 8% to $0.98 per share, reflecting management’s confidence in continuing cash flows, while Anthropic committed to around $44.9 billion in Azure cloud spending, providing future business visibility — though price action has remained under broader selling pressure.
Short-term weakness contrasts with long-term support and mixed signals
On the hourly chart, MSFT is trading below both the MA-20 and MA-50, indicating ongoing short- and medium-term downside. On the daily timeframe, the price remains well above the MA-200, underscoring strong long-term structural support. The Ichimoku Kijun sits at $525.2 as immediate support. The MACD gives a strong buy signal, while the ADX remains on sell, highlighting a divergence in momentum. RSI stands at 45.84 (sell), with Stochastic RSI in the oversold zone, suggesting downside exhaustion. CCI is neutral, and Bull/Bear Power is oversold, pointing to sustained seller dominance during intraday trading. The Awesome Oscillator is neutral and does not indicate a prevailing short-term trend.
Downside risk dominates within established volatility range
Over the next several sessions, MSFT is expected to trade within a typical volatility band from $519.32 to $536.04. There is a 35% probability of an upward move and a 65% likelihood of further downside within this range, signaling consolidation in a sideways corridor as the baseline scenario. Should buyers regain momentum and surpass resistance, the price could extend above the top of the range. Conversely, a break below established support would expose MSFT to additional selling pressure and further downside risk.
Earlier, analysts noted that Microsoft's outlook relied on exceptional earnings growth to justify further advances, especially amid a market environment shaped by AI momentum, concentrated performance in a few stocks, and increasing macroeconomic risks. The current technical and corporate developments signal that consolidation below key moving averages remains the prevailing scenario, with a break of immediate support potentially opening the way for increased downside risk.






Latest Microsoft News





-
 Afghanistan
-
 Albania
-
 Algeria
-
 Angola
-
 Argentina
-
 Armenia
-
 Australia
-
 Austria
-
 Azerbaijan
-
 Bahamas
-
 Bahrain
-
 Bangladesh
-
 Belarus
-
 Belgium
-
 Bolivia
-
 Botswana
-
 Brazil
-
 Brunei
-
 Bulgaria
-
 Cambodia
-
 Cameroon
-
 Canada
-
 Chile
-
 China
-
 Colombia
-
 Congo
-
 Costa Rica
-
 Cote d'Ivoire
-
 Croatia
-
 Cuba
-
 Cyprus
-
 Czechia
-
 DR Congo
-
 Denmark
-
 Dominican Republic
-
 Ecuador
-
 Egypt
-
 El Salvador
-
 Estonia
-
 Eswatini
-
 Ethiopia
-
 Finland
-
 France
-
 Georgia
-
 Germany
-
 Ghana
-
 Greece
-
 Haiti
-
 Hong Kong
-
 Hungary
-
 India
-
 Indonesia
-
 Iran, Islamic republic
-
 Iraq
-
 Ireland
-
 Israel
-
 Italy
-
 Jamaica
-
 Japan
-
 Jordan
-
 Kazakhstan
-
 Kenya
-
 Korea
-
 Kuwait
-
 Kyrgyzstan
-
 Laos
-
 Latvia
-
 Lebanon
-
 Lesotho
-
 Libya
-
 Lithuania
-
 Luxembourg
-
 Madagascar
-
 Malaysia
-
 Malta
-
 Mauritius
-
 Mexico
-
 Moldova
-
 Mongolia
-
 Montenegro
-
 Morocco
-
 Mozambique
-
 Myanmar
-
 Namibia
-
 Nepal
-
 Netherlands
-
 New Zealand
-
 Nigeria
-
 North Macedonia
-
 Norway
-
 Oman
-
 Pakistan
-
 Palestine
-
 Panama
-
 Papua New Guinea
-
 Paraguay
-
 Peru
-
 Philippines
-
 Poland
-
 Portugal
-
 Puerto Rico
-
 Qatar
-
 Reunion
-
 Romania
-
 Rwanda
-
 Saudi Arabia
-
 Serbia
-
 Singapore
-
 Slovakia
-
 Slovenia
-
 Somalia
-
 South Africa
-
 Spain
-
 Sri Lanka
-
 Sweden
-
 Switzerland
-
 Syria
-
 Taiwan
-
 Tajikistan
-
 Tanzania
-
 Thailand
-
 Trinidad and Tobago
-
 Tunisia
-
 Turkey
-
 UAE
-
 Uganda
-
 Ukraine
-
 United Kingdom
-
United States
-
 Uruguay
-
 Uzbekistan
-
 Venezuela
-
 Vietnam
-
 Yemen
-
 Zambia
-
 Zimbabwe
- Forex
- Crypto












