

ServiceNow stock outlook: Seller dominance persists ahead of Q3 earnings risk

ServiceNow Inc. (NOW) stock is trading at $150.46, down 2.83% on the day and ending near session lows. The price is positioned below its key short- and medium-term moving averages, but remains above its long-term average.
 109.22
155.01
Highlights
- ServiceNow has expanded its partnership with Google Cloud, integrating Action Fabric with Gemini Enterprise for secure workflow automation.
- Three new workflow integrations are now available for joint customers in retail, CRM, and IT management.
- Shares of ServiceNow trade below key moving averages with strong seller momentum, and a 2 to 3 day range of $147.69 to $153.23 is expected.
Workflow integrations expand as Google partnership and earnings approach
ServiceNow has extended its collaboration with Google Cloud, integrating its Action Fabric technology with Google's Gemini Enterprise platform to enable more secure and efficient workflow automation for enterprise clients, according to Gurufocus. This partnership has resulted in three newly available workflow integrations for retail, CRM, and IT tasks, broadening the immediate applicability of ServiceNow’s solutions for joint customers, as reported by Tokenpost. Additionally, the approach of ServiceNow’s third-quarter earnings release on October 28, 2026, introduces event risk and may influence investor positioning, according to Yahoo Finance.
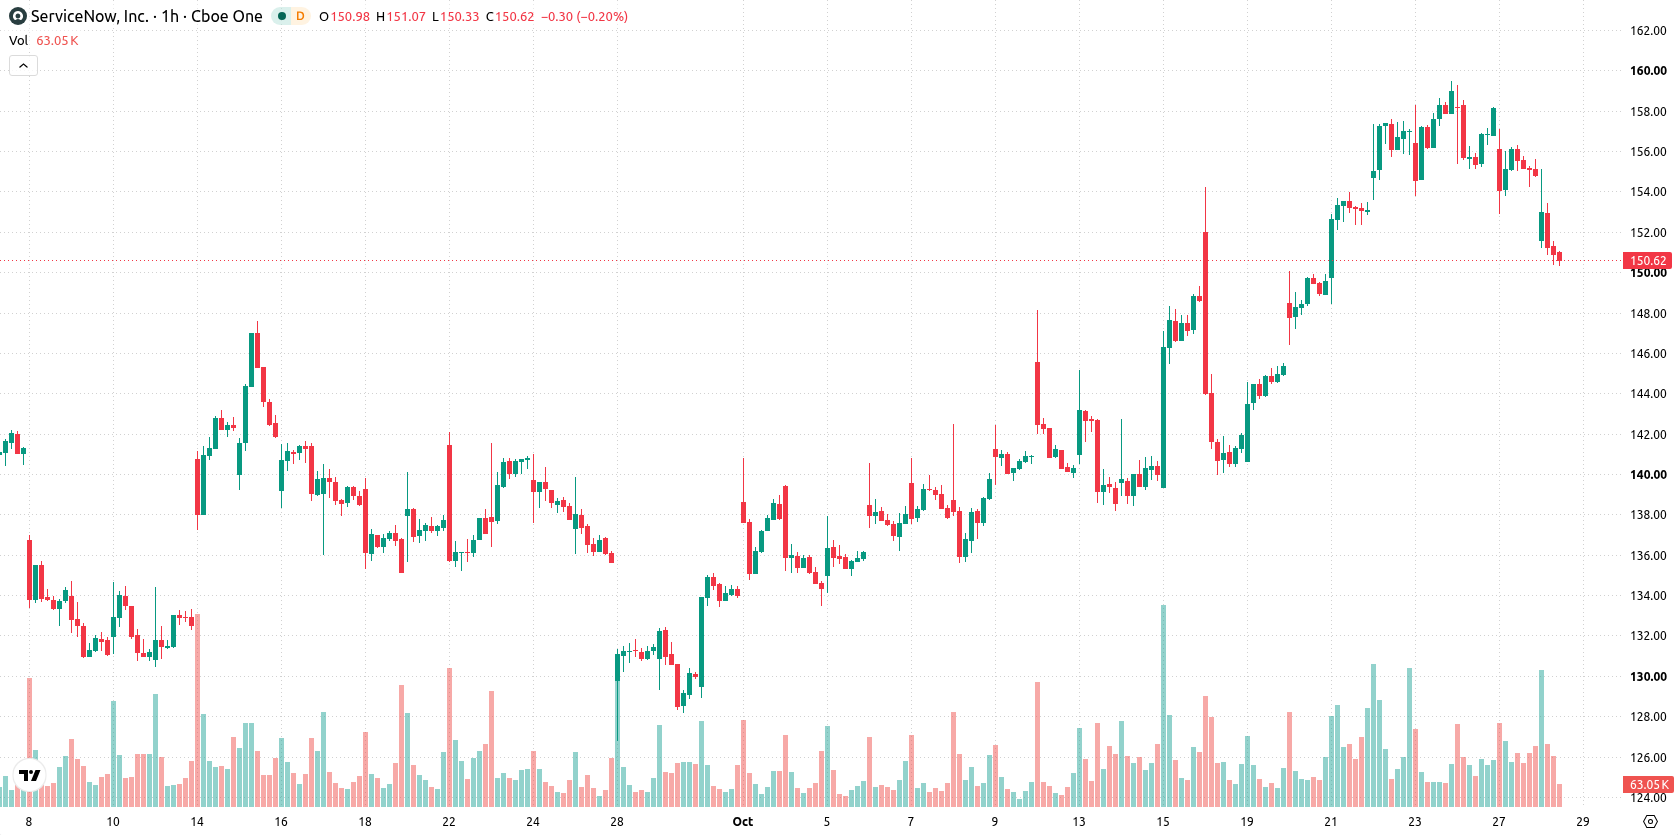
Seller dominance persists as momentum signals diverge at resistance
NOW/USD is currently trading below the MA-20 at $156.45 and MA-50 at $152.96, reflecting near- and medium-term seller control, while staying well above the MA-200 at $115.24 (daily timeframe). Immediate resistance is located at the Ichimoku Kijun level of $156.1. Momentum signals are mixed: MACD signals Strong Buy, but ADX points to a Sell, with clear divergence. The RSI stands at 48.39, CCI signals Sell, and Stoch RSI is in oversold territory. Bull/Bear Power highlights oversold conditions, indicating pronounced seller dominance on an intraday basis, and the Awesome Oscillator is also aligned with the broader selling trend.
Downside risk elevated as volatility bands constrain direction
Looking ahead to the next two or three trading days, the expected trading range is $147.69 to $153.23. There is a 64% probability of a continued downward move, while the likelihood of an upward reversal stands at 36%. Baseline expectations point to consolidation within this volatility band. A bullish breakout would require the price to clear resistance at $156.1, while a breach below $147.69 could open the way to further downside.
Previously it was reported that ServiceNow's technical setup appeared vulnerable to short-term downside, with investors focused on whether the stock could maintain key support following expansion of its Google Cloud partnership. The current analysis reinforces this cautious outlook, highlighting a prevailing seller-driven trend and pointing to $147.69 as the key level to watch for potential further downside risk in the days ahead.






Latest ServiceNow News



-
 Afghanistan
-
 Albania
-
 Algeria
-
 Angola
-
 Argentina
-
 Armenia
-
 Australia
-
 Austria
-
 Azerbaijan
-
 Bahamas
-
 Bahrain
-
 Bangladesh
-
 Belarus
-
 Belgium
-
 Bolivia
-
 Botswana
-
 Brazil
-
 Brunei
-
 Bulgaria
-
 Cambodia
-
 Cameroon
-
 Canada
-
 Chile
-
 China
-
 Colombia
-
 Congo
-
 Costa Rica
-
 Cote d'Ivoire
-
 Croatia
-
 Cuba
-
 Cyprus
-
 Czechia
-
 DR Congo
-
 Denmark
-
 Dominican Republic
-
 Ecuador
-
 Egypt
-
 El Salvador
-
 Estonia
-
 Eswatini
-
 Ethiopia
-
 Finland
-
 France
-
 Georgia
-
 Germany
-
 Ghana
-
 Greece
-
 Haiti
-
 Hong Kong
-
 Hungary
-
 India
-
 Indonesia
-
 Iran, Islamic republic
-
 Iraq
-
 Ireland
-
 Israel
-
 Italy
-
 Jamaica
-
 Japan
-
 Jordan
-
 Kazakhstan
-
 Kenya
-
 Korea
-
 Kuwait
-
 Kyrgyzstan
-
 Laos
-
 Latvia
-
 Lebanon
-
 Lesotho
-
 Libya
-
 Lithuania
-
 Luxembourg
-
 Madagascar
-
 Malaysia
-
 Malta
-
 Mauritius
-
 Mexico
-
 Moldova
-
 Mongolia
-
 Montenegro
-
 Morocco
-
 Mozambique
-
 Myanmar
-
 Namibia
-
 Nepal
-
 Netherlands
-
 New Zealand
-
 Nigeria
-
 North Macedonia
-
 Norway
-
 Oman
-
 Pakistan
-
 Palestine
-
 Panama
-
 Papua New Guinea
-
 Paraguay
-
 Peru
-
 Philippines
-
 Poland
-
 Portugal
-
 Puerto Rico
-
 Qatar
-
 Reunion
-
 Romania
-
 Rwanda
-
 Saudi Arabia
-
 Serbia
-
 Singapore
-
 Slovakia
-
 Slovenia
-
 Somalia
-
 South Africa
-
 Spain
-
 Sri Lanka
-
 Sweden
-
 Switzerland
-
 Syria
-
 Taiwan
-
 Tajikistan
-
 Tanzania
-
 Thailand
-
 Trinidad and Tobago
-
 Tunisia
-
 Turkey
-
 UAE
-
 Uganda
-
 Ukraine
-
 United Kingdom
-
United States
-
 Uruguay
-
 Uzbekistan
-
 Venezuela
-
 Vietnam
-
 Yemen
-
 Zambia
-
 Zimbabwe
- Forex
- Crypto












