

Johnson & Johnson shares weekly forecast: Consolidation expected as price volatility and resistance limit upside

Shares of Johnson & Johnson (JNJ) are trading near $275 after rising more than 4% this week as recovery momentum persists. Strong corporate fundamentals continue to underpin the advance — but with several indicators stretched, the coming week will test whether this rally can hold without a pause.
 277.73
Highlights
- Shares of Johnson & Johnson rose 4.19% to $274.91 over the past week, reaching the top of the recent range.
- Technical momentum remains bullish with the stock trading above major trend indicators, but overbought readings increase pullback risk.
- Shares are expected to range between $256.9 and $279.54 in the next five days, with 79% probability of further gains.
Revenue upgrades and legal headlines drive Johnson & Johnson sentiment shifts
Johnson & Johnson reported robust third-quarter results, with pharmaceutical revenue rising 5.9% to reach $25.4 billion and the company raising its 2026 revenue projection, according to Seeking Alpha. The company also announced a fourth-quarter cash dividend of $1.34 per share, payable December 8, 2026, as reported by Business Wire. Trail updates in oncology and medtech, as well as ongoing legal charges related to talc litigation, are set to influence sentiment in the days ahead.
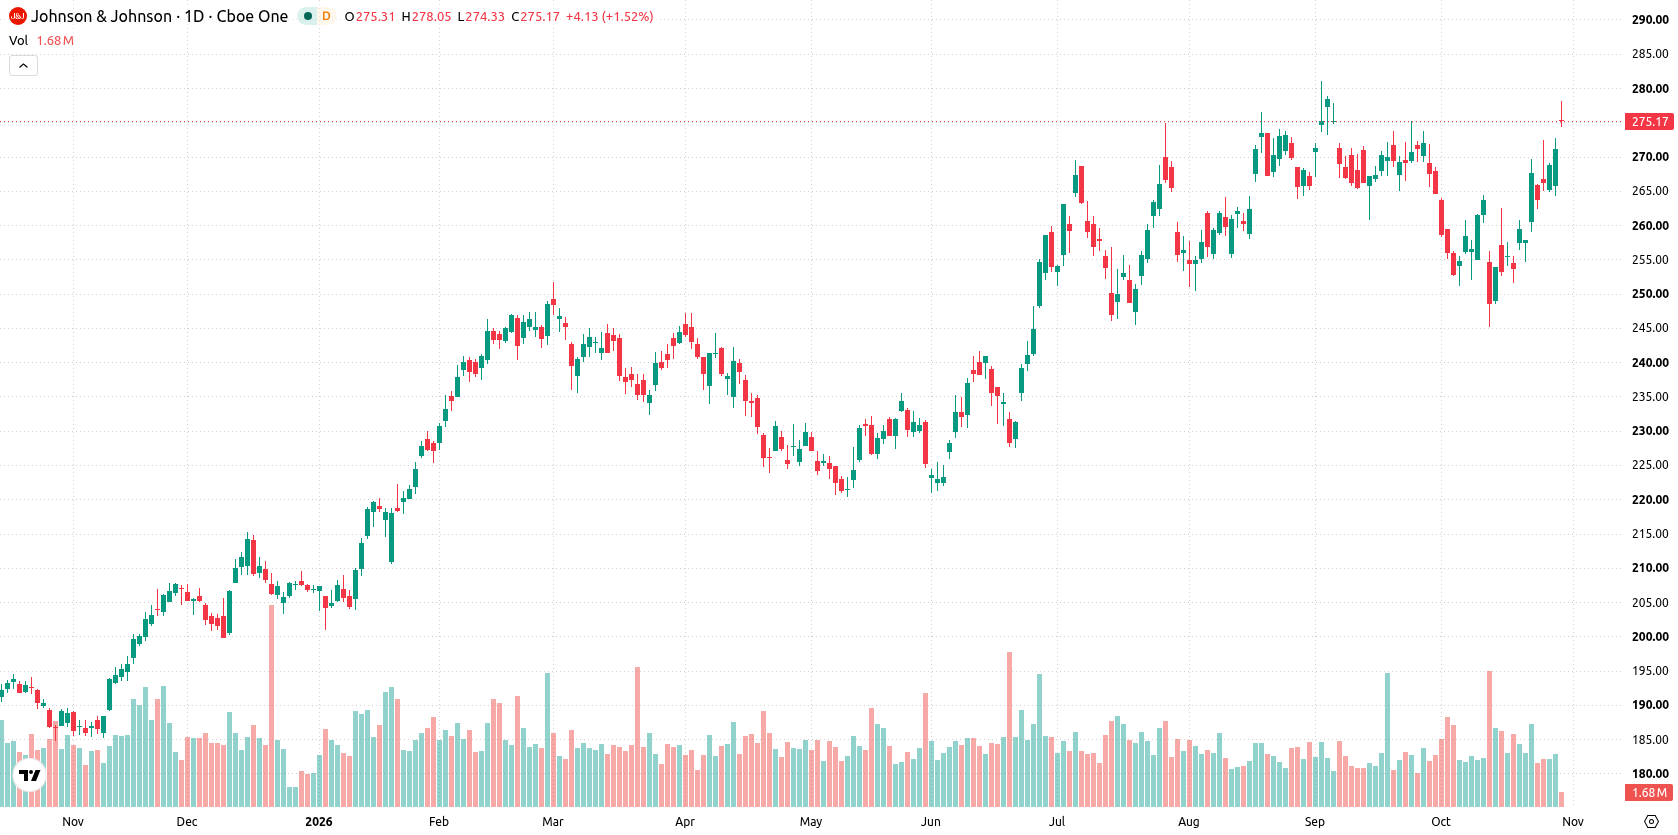
Momentum divergence emerges as overbought signals flag risk of pullback
The daily chart reveals a contained move within a narrow range, with short-term volatility at 3.95%. Both the CCI (163.42) and Stochastic RSI (100) show overbought extremes, indicating potential overheating and increasing the possibility for a near-term pullback despite strong recent gains. RSI remains neutral, providing a counterpoint and highlighting a divergence in momentum signals. Nearest support sits at $272.75, while the Ichimoku Kijun at $259.89 offers additional downside protection.
Consolidation likely in coming week as breakout risk remains elevated
For the next five trading days, the stock is expected to range between $256.9 and $279.54. The probability of an increase stands at 79%, with a 21% chance of a decrease. The base case favors consolidation between $272.75 and resistance at the range high. A bullish continuation above $279.54 would open further upside, while a drop below $272.75 could see the shares test the lower boundary near the Kijun support.
Previously it was reported that Johnson & Johnson was exhibiting firm technical momentum and maintained a bullish structure amid positive earnings guidance and shareholder returns. With technical indicators now signaling overbought conditions, traders should watch for potential consolidation or a shift in momentum, particularly as price action approaches resistance near $279.54.






Latest Johnson & Johnson News





-
 Afghanistan
-
 Albania
-
 Algeria
-
 Angola
-
 Argentina
-
 Armenia
-
 Australia
-
 Austria
-
 Azerbaijan
-
 Bahamas
-
 Bahrain
-
 Bangladesh
-
 Belarus
-
 Belgium
-
 Bolivia
-
 Botswana
-
 Brazil
-
 Brunei
-
 Bulgaria
-
 Cambodia
-
 Cameroon
-
 Canada
-
 Chile
-
 China
-
 Colombia
-
 Congo
-
 Costa Rica
-
 Cote d'Ivoire
-
 Croatia
-
 Cuba
-
 Cyprus
-
 Czechia
-
 DR Congo
-
 Denmark
-
 Dominican Republic
-
 Ecuador
-
 Egypt
-
 El Salvador
-
 Estonia
-
 Eswatini
-
 Ethiopia
-
 Finland
-
 France
-
 Georgia
-
 Germany
-
 Ghana
-
 Greece
-
 Haiti
-
 Hong Kong
-
 Hungary
-
 India
-
 Indonesia
-
 Iran, Islamic republic
-
 Iraq
-
 Ireland
-
 Israel
-
 Italy
-
 Jamaica
-
 Japan
-
 Jordan
-
 Kazakhstan
-
 Kenya
-
 Korea
-
 Kuwait
-
 Kyrgyzstan
-
 Laos
-
 Latvia
-
 Lebanon
-
 Lesotho
-
 Libya
-
 Lithuania
-
 Luxembourg
-
 Madagascar
-
 Malaysia
-
 Malta
-
 Mauritius
-
 Mexico
-
 Moldova
-
 Mongolia
-
 Montenegro
-
 Morocco
-
 Mozambique
-
 Myanmar
-
 Namibia
-
 Nepal
-
 Netherlands
-
 New Zealand
-
 Nigeria
-
 North Macedonia
-
 Norway
-
 Oman
-
 Pakistan
-
 Palestine
-
 Panama
-
 Papua New Guinea
-
 Paraguay
-
 Peru
-
 Philippines
-
 Poland
-
 Portugal
-
 Puerto Rico
-
 Qatar
-
 Reunion
-
 Romania
-
 Rwanda
-
 Saudi Arabia
-
 Serbia
-
 Singapore
-
 Slovakia
-
 Slovenia
-
 Somalia
-
 South Africa
-
 Spain
-
 Sri Lanka
-
 Sweden
-
 Switzerland
-
 Syria
-
 Taiwan
-
 Tajikistan
-
 Tanzania
-
 Thailand
-
 Trinidad and Tobago
-
 Tunisia
-
 Turkey
-
 UAE
-
 Uganda
-
 Ukraine
-
 United Kingdom
-
United States
-
 Uruguay
-
 Uzbekistan
-
 Venezuela
-
 Vietnam
-
 Yemen
-
 Zambia
-
 Zimbabwe
- Forex
- Crypto












