

Intel stock forecast: Mixed momentum and overbought signals challenge short-term direction

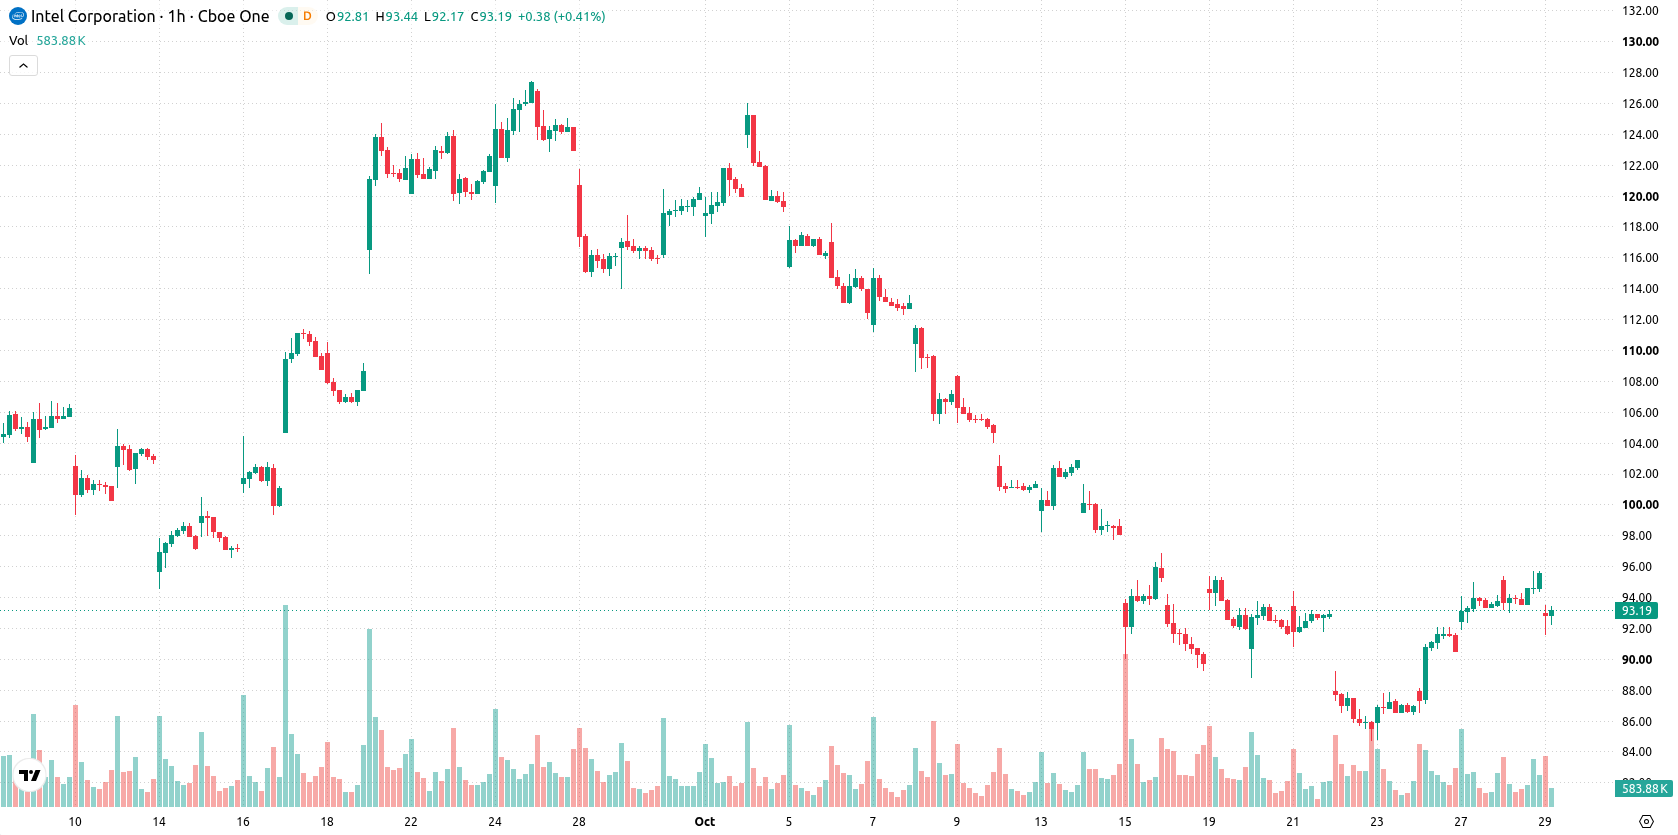
Intel (INTC) stock is trading at $92.24, down 3.39% for the day and closing near the session’s low. The move places the price below its key short-term moving average, while still trading above medium- and long-term averages.
 95.68
95.68
Highlights
- Intel announced a $2.3 billion acquisition of Classiq, adding advanced quantum software capabilities to its technology portfolio.
- Intel expanded its partnership with Oracle, enhancing Xeon-based computing for enterprise and artificial intelligence applications on Oracle Cloud Infrastructure.
- Shares of Intel closed at $92.24, down 3.39% on the day, with technicals indicating short-term pressure but a medium- to long-term bullish structure and an expected trading range of $87.35 to $97.54.
Quantum software deal and cloud partnership expand reach amid selling pressure
Intel’s announcement on October 28 of a $2.3 billion acquisition of quantum software firm Classiq immediately adds advanced quantum technology to Intel’s portfolio, aiming to accelerate its presence in the next-generation computing market, as reported by Moneycheck. This corporate action is poised to broaden Intel’s strategic position in high-value product segments and enable new growth opportunities. Another notable event, the expansion of Intel’s multiyear partnership with Oracle to increase Xeon-based computing on Oracle Cloud Infrastructure, targets growth in enterprise applications and artificial intelligence, according to Hpcwire. While these recent developments enhance Intel’s technology footprint, price action has remained under broader selling pressure.
Buy signals persist despite overbought readings and mixed oscillator cues
INTC is trading below the MA-20 at $93.15 but remains above both the MA-50 at $90.89 and the MA-200 at $86.53. The Ichimoku Kijun level marks immediate support at $91.23. Among indicators, MACD and ADX continue to register buy-side strength, while both RSI and CCI reflect overbought conditions. Stoch RSI gives a sell signal, Bull/Bear Power signals ongoing buyer influence, and Awesome Oscillator remains neutral. The divergence among momentum signals and oscillators, with intraday price weakness against a background of persistent bullish momentum, suggests a mixed technical landscape.
Range-bound trade likely as volatility and breakout risks persist
For the next few sessions, INTC is expected to remain in a typical volatility range of $87.35 to $97.54. The most probable scenario is stabilization within these bounds, with a 67% probability assigned to an upward move. Should resistance be breached, a bullish extension becomes likely, while a failure of support could prompt further declines. Both medium-term structure and short-term volatility should be monitored as price reacts to these technical levels.
Earlier, analysts noted that heightened post-earnings volatility and lingering downside risks warranted a cautious approach for short-term Intel traders. With current indicators presenting a mixed technical backdrop and Intel trading within a defined volatility range, monitoring for a decisive move above resistance or below support will be key to identifying the next directional shift.











-
 Afghanistan
-
 Albania
-
 Algeria
-
 Angola
-
 Argentina
-
 Armenia
-
 Australia
-
 Austria
-
 Azerbaijan
-
 Bahamas
-
 Bahrain
-
 Bangladesh
-
 Belarus
-
 Belgium
-
 Bolivia
-
 Botswana
-
 Brazil
-
 Brunei
-
 Bulgaria
-
 Cambodia
-
 Cameroon
-
 Canada
-
 Chile
-
 China
-
 Colombia
-
 Congo
-
 Costa Rica
-
 Cote d'Ivoire
-
 Croatia
-
 Cuba
-
 Cyprus
-
 Czechia
-
 DR Congo
-
 Denmark
-
 Dominican Republic
-
 Ecuador
-
 Egypt
-
 El Salvador
-
 Estonia
-
 Eswatini
-
 Ethiopia
-
 Finland
-
 France
-
 Georgia
-
 Germany
-
 Ghana
-
 Greece
-
 Haiti
-
 Hong Kong
-
 Hungary
-
 India
-
 Indonesia
-
 Iran, Islamic republic
-
 Iraq
-
 Ireland
-
 Israel
-
 Italy
-
 Jamaica
-
 Japan
-
 Jordan
-
 Kazakhstan
-
 Kenya
-
 Korea
-
 Kuwait
-
 Kyrgyzstan
-
 Laos
-
 Latvia
-
 Lebanon
-
 Lesotho
-
 Libya
-
 Lithuania
-
 Luxembourg
-
 Madagascar
-
 Malaysia
-
 Malta
-
 Mauritius
-
 Mexico
-
 Moldova
-
 Mongolia
-
 Montenegro
-
 Morocco
-
 Mozambique
-
 Myanmar
-
 Namibia
-
 Nepal
-
 Netherlands
-
 New Zealand
-
 Nigeria
-
 North Macedonia
-
 Norway
-
 Oman
-
 Pakistan
-
 Palestine
-
 Panama
-
 Papua New Guinea
-
 Paraguay
-
 Peru
-
 Philippines
-
 Poland
-
 Portugal
-
 Puerto Rico
-
 Qatar
-
 Reunion
-
 Romania
-
 Rwanda
-
 Saudi Arabia
-
 Serbia
-
 Singapore
-
 Slovakia
-
 Slovenia
-
 Somalia
-
 South Africa
-
 Spain
-
 Sri Lanka
-
 Sweden
-
 Switzerland
-
 Syria
-
 Taiwan
-
 Tajikistan
-
 Tanzania
-
 Thailand
-
 Trinidad and Tobago
-
 Tunisia
-
 Turkey
-
 UAE
-
 Uganda
-
 Ukraine
-
 United Kingdom
-
United States
-
 Uruguay
-
 Uzbekistan
-
 Venezuela
-
 Vietnam
-
 Yemen
-
 Zambia
-
 Zimbabwe
- Forex
- Crypto












