


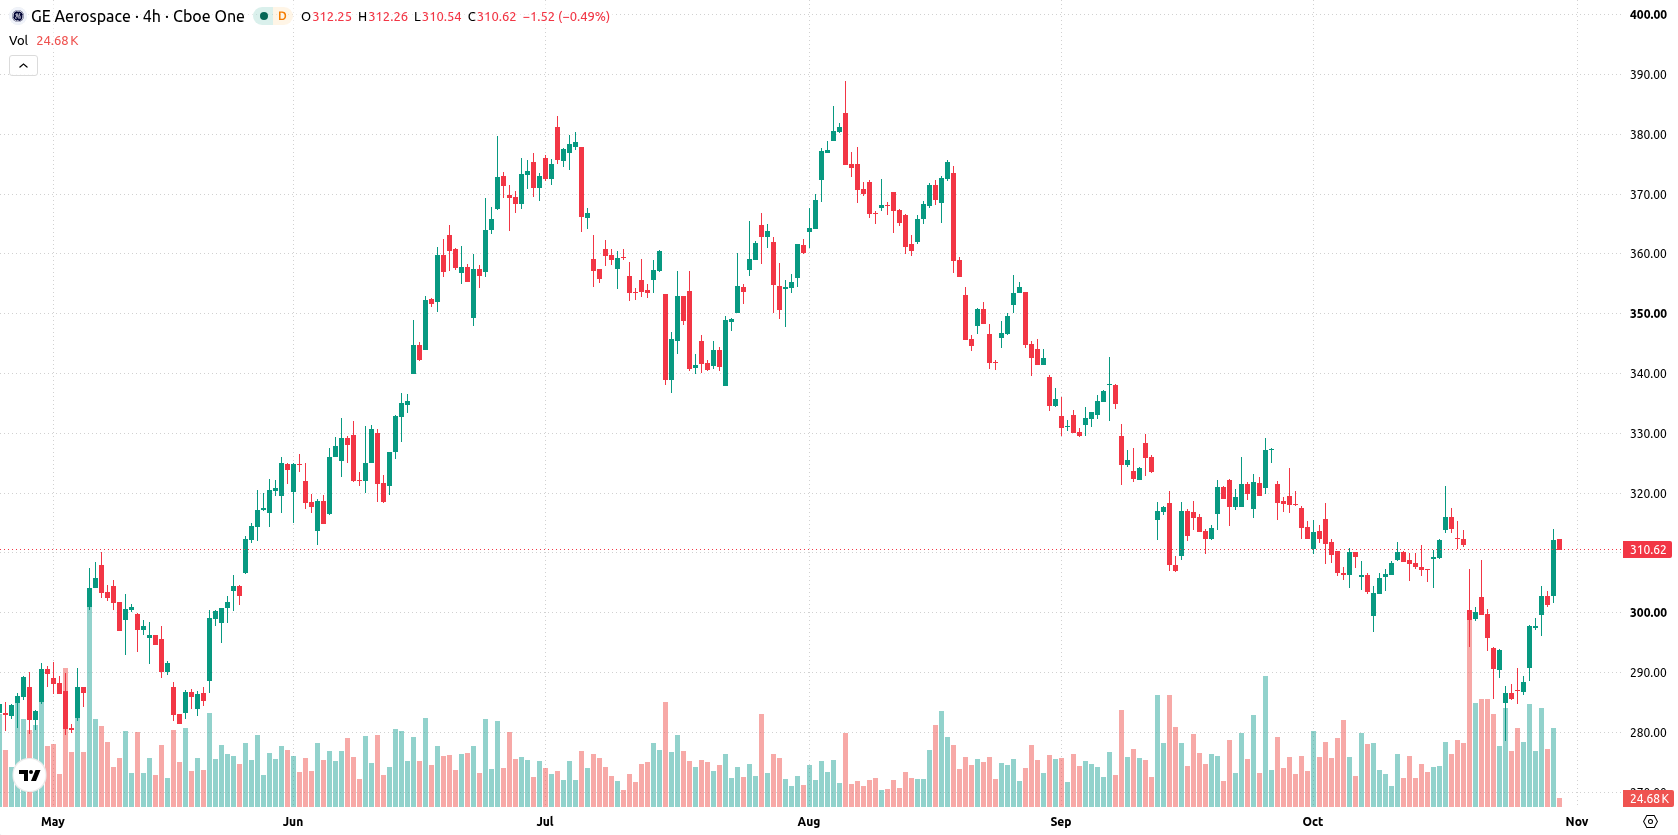
GE Aerospace (GE) is climbing 3.39% as improved revenues and its leadership position following recent business spin-offs are drawing renewed buying interest. The rally is showing short-term momentum, yet the advance looks limited, with the stock trading below its 50- and 200-day moving averages and in a medium- to long-term bearish structure.
 313.88
Highlights
- GE Aerospace reported trailing-12-month revenue of $52.58 billion, up 22.4% year over year after spin-offs.
- Shares of GE Aerospace have declined 2.96% year to date with a price-to-earnings ratio of 34.38 and a dividend yield of 0.61%.
- The stock trades in a short-term bullish recovery but faces medium- and long-term bearish signals, with a projected range of $298.62 to $324.08 and mixed momentum indicators.
Revenue surge and core role drive valuation amid mixed share performance
GE Aerospace reported trailing-12-month revenue of $52.58 billion, reflecting a 22.4% increase year over year as the company continues as the core of General Electric after the GE HealthCare and GE Vernova spin-offs. It maintains its role as a leading manufacturer of commercial and military aircraft engines. The latest update shows a GF Score of 82, a price-to-earnings ratio of 34.38, and a dividend yield of 0.61%. Shares have declined 2.96% year to date.
Technical resistance and mixed momentum as buyers test short-term highs
GE is trading above its 20-day moving average at $303.92, but remains under the 50-day at $319.05 and 200-day at $322.88. This signals a short-term bullish recovery within a broader medium- and long-term bearish trend. Near-term support is seen at $304.47, with resistance at $312.63, and the Ichimoku Kijun at $303.88 adds further support. Momentum signals are mixed: both the MACD and ADX forecast a sell, and the RSI stands at 44.21, also signaling selling momentum. However, the Stochastic RSI at 86.83 and Bull/Bear Power at 4.12 show overbought conditions and buyer dominance intraday. The Commodity Channel Index (CCI) and Awesome Oscillator are neutral. GE is trading near its session highs after an upside gap, with intraday volatility at 3.61%, and underlying momentum indicators diverge as price action shows bullish strength not fully endorsed by momentum signals.
Earlier, analysts noted that GE Aerospace was benefiting from institutional accumulation and bullish technical signals, which suggested a positive bias for the stock. The current technical setup, however, highlights a medium- to long-term bearish structure despite short-term momentum, making $312.63 a critical resistance level to monitor for signs of a potential breakout or renewed downside pressure.






Latest General Electric News





-
 Afghanistan
-
 Albania
-
 Algeria
-
 Angola
-
 Argentina
-
 Armenia
-
 Australia
-
 Austria
-
 Azerbaijan
-
 Bahamas
-
 Bahrain
-
 Bangladesh
-
 Belarus
-
 Belgium
-
 Bolivia
-
 Botswana
-
 Brazil
-
 Brunei
-
 Bulgaria
-
 Cambodia
-
 Cameroon
-
 Canada
-
 Chile
-
 China
-
 Colombia
-
 Congo
-
 Costa Rica
-
 Cote d'Ivoire
-
 Croatia
-
 Cuba
-
 Cyprus
-
 Czechia
-
 DR Congo
-
 Denmark
-
 Dominican Republic
-
 Ecuador
-
 Egypt
-
 El Salvador
-
 Estonia
-
 Eswatini
-
 Ethiopia
-
 Finland
-
 France
-
 Georgia
-
 Germany
-
 Ghana
-
 Greece
-
 Haiti
-
 Hong Kong
-
 Hungary
-
 India
-
 Indonesia
-
 Iran, Islamic republic
-
 Iraq
-
 Ireland
-
 Israel
-
 Italy
-
 Jamaica
-
 Japan
-
 Jordan
-
 Kazakhstan
-
 Kenya
-
 Korea
-
 Kuwait
-
 Kyrgyzstan
-
 Laos
-
 Latvia
-
 Lebanon
-
 Lesotho
-
 Libya
-
 Lithuania
-
 Luxembourg
-
 Madagascar
-
 Malaysia
-
 Malta
-
 Mauritius
-
 Mexico
-
 Moldova
-
 Mongolia
-
 Montenegro
-
 Morocco
-
 Mozambique
-
 Myanmar
-
 Namibia
-
 Nepal
-
 Netherlands
-
 New Zealand
-
 Nigeria
-
 North Macedonia
-
 Norway
-
 Oman
-
 Pakistan
-
 Palestine
-
 Panama
-
 Papua New Guinea
-
 Paraguay
-
 Peru
-
 Philippines
-
 Poland
-
 Portugal
-
 Puerto Rico
-
 Qatar
-
 Reunion
-
 Romania
-
 Rwanda
-
 Saudi Arabia
-
 Serbia
-
 Singapore
-
 Slovakia
-
 Slovenia
-
 Somalia
-
 South Africa
-
 Spain
-
 Sri Lanka
-
 Sweden
-
 Switzerland
-
 Syria
-
 Taiwan
-
 Tajikistan
-
 Tanzania
-
 Thailand
-
 Trinidad and Tobago
-
 Tunisia
-
 Turkey
-
 UAE
-
 Uganda
-
 Ukraine
-
 United Kingdom
-
United States
-
 Uruguay
-
 Uzbekistan
-
 Venezuela
-
 Vietnam
-
 Yemen
-
 Zambia
-
 Zimbabwe
- Forex
- Crypto












