

Can broader index futures weakness pressure S&P 500 index?

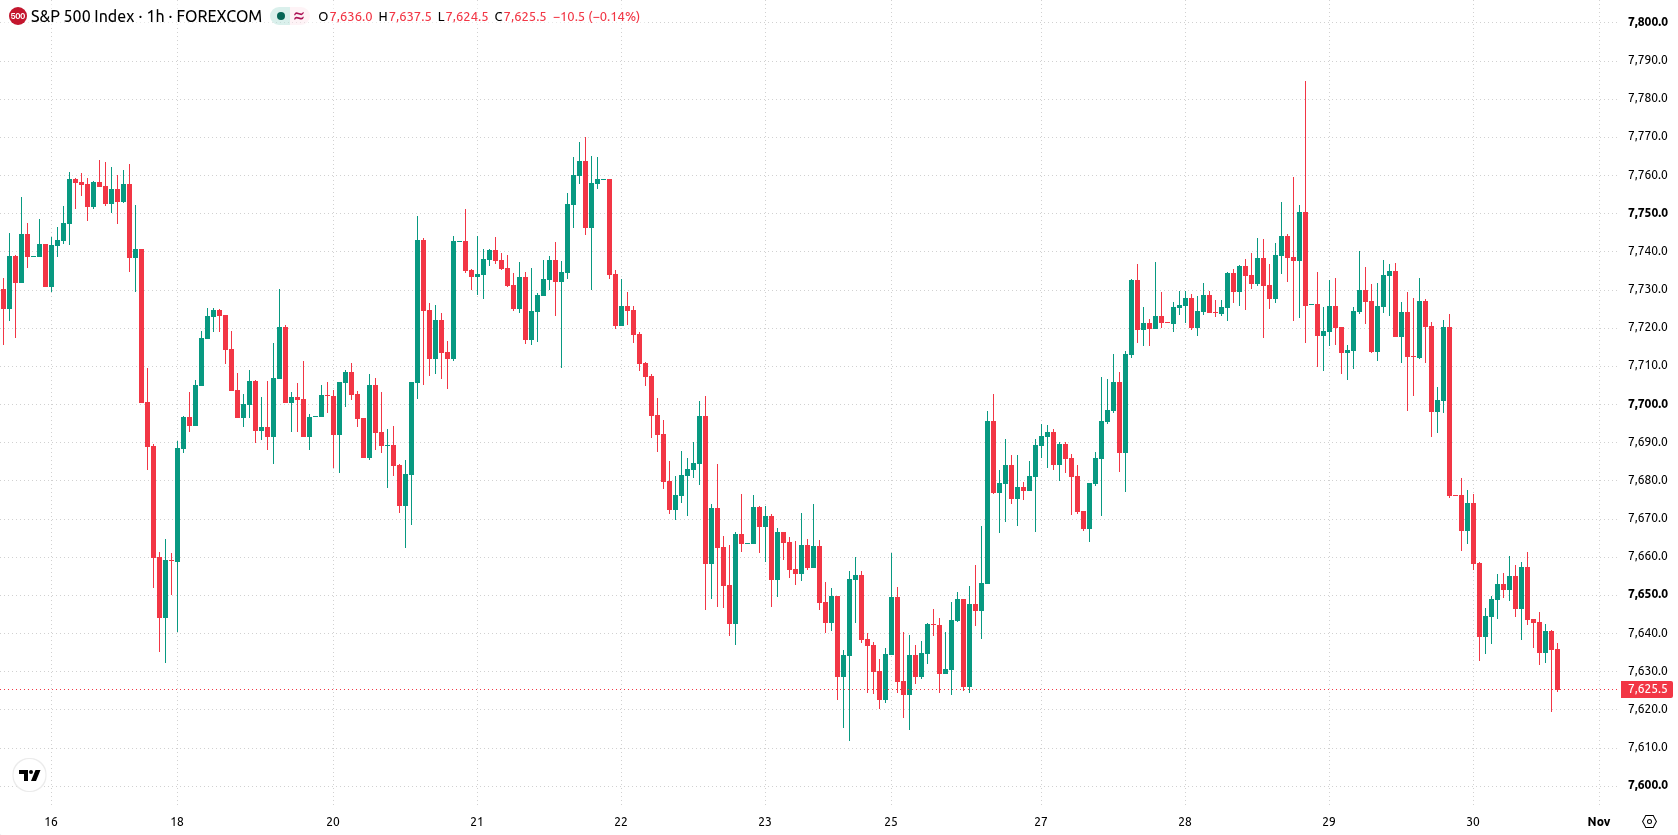
S&P 500 (SPX) is trading at 7,626, down 1.22% for the day. The index is currently below its key short- and medium-term moving averages, while still remaining above long-term trend levels.
 7415.26
7617.27
Highlights
- S&P 500 futures declined 0.28% in pre-market trading, suggesting broader weakness in U.S. equity index futures.
- Market participants adopted a risk-off stance, pushing the S&P 500 lower and exerting downward pressure on equities.
- The index trades below key short- and medium-term moving averages, with a 7,588 to 7,664 range expected over the next three sessions and a 72% probability of further downside.
Bearish flows accelerate as risk-off sentiment dominates index futures
S&P 500 futures registered a 0.28% decline in pre-market trading, reflecting a broader downturn in U.S. equity index futures, according to TradingKey. This widespread weakness signals a cautious or risk-off stance among market participants, contributing to downward pressure on the index. The overall bearish sentiment in equity markets is thus mirrored in the S&P 500’s performance today.
Range-bound price action as mixed signals clash with weak resistance
SPX/USD was unable to break above the Ichimoku Kijun level at 7,713, which remains the nearest resistance. Support is defined at 7,588, with technical structure on the H1 chart shaped by the asset trading below the MA-20 and MA-50, while the daily trend is preserved above the MA-200. Momentum signals remain somewhat mixed, as MACD and ADX both print buy signals, but oscillators show limited upside: RSI sits at 53.2 (Buy), Stoch RSI and CCI are neutral, and Bull/Bear Power indicates overbought intraday conditions. This divergence points toward soft short-term action despite underlying momentum signals.
Bearish bias expected as volatility bands cap rebound hopes
Over the next 2 to 3 trading days, SPX/USD is seen holding within a typical volatility band bounded by 7,588 and 7,664. Models suggest a 72% probability of a continued move lower, against a 28% chance of a rebound. The baseline expectation is for the index to stay in this range; a bullish scenario would require a close above 7,713, while a decisive drop below 7,588 would reinforce the bearish outlook.
Earlier, analysts noted that disappointing earnings from major technology companies triggered a broad selloff in equities, highlighting concerns about the sustainability of AI-related investments and diverging sector performance. The latest technical outlook for the S&P 500 reinforces the prevailing caution, with traders advised to watch the 7,588 support level as a decisive break below it could accelerate further downside movement in the near term.






Latest S&P 500 News





-
 Afghanistan
-
 Albania
-
 Algeria
-
 Angola
-
 Argentina
-
 Armenia
-
 Australia
-
 Austria
-
 Azerbaijan
-
 Bahamas
-
 Bahrain
-
 Bangladesh
-
 Belarus
-
 Belgium
-
 Bolivia
-
 Botswana
-
 Brazil
-
 Brunei
-
 Bulgaria
-
 Cambodia
-
 Cameroon
-
 Canada
-
 Chile
-
 China
-
 Colombia
-
 Congo
-
 Costa Rica
-
 Cote d'Ivoire
-
 Croatia
-
 Cuba
-
 Cyprus
-
 Czechia
-
 DR Congo
-
 Denmark
-
 Dominican Republic
-
 Ecuador
-
 Egypt
-
 El Salvador
-
 Estonia
-
 Eswatini
-
 Ethiopia
-
 Finland
-
 France
-
 Georgia
-
 Germany
-
 Ghana
-
 Greece
-
 Haiti
-
 Hong Kong
-
 Hungary
-
 India
-
 Indonesia
-
 Iran, Islamic republic
-
 Iraq
-
 Ireland
-
 Israel
-
 Italy
-
 Jamaica
-
 Japan
-
 Jordan
-
 Kazakhstan
-
 Kenya
-
 Korea
-
 Kuwait
-
 Kyrgyzstan
-
 Laos
-
 Latvia
-
 Lebanon
-
 Lesotho
-
 Libya
-
 Lithuania
-
 Luxembourg
-
 Madagascar
-
 Malaysia
-
 Malta
-
 Mauritius
-
 Mexico
-
 Moldova
-
 Mongolia
-
 Montenegro
-
 Morocco
-
 Mozambique
-
 Myanmar
-
 Namibia
-
 Nepal
-
 Netherlands
-
 New Zealand
-
 Nigeria
-
 North Macedonia
-
 Norway
-
 Oman
-
 Pakistan
-
 Palestine
-
 Panama
-
 Papua New Guinea
-
 Paraguay
-
 Peru
-
 Philippines
-
 Poland
-
 Portugal
-
 Puerto Rico
-
 Qatar
-
 Reunion
-
 Romania
-
 Rwanda
-
 Saudi Arabia
-
 Serbia
-
 Singapore
-
 Slovakia
-
 Slovenia
-
 Somalia
-
 South Africa
-
 Spain
-
 Sri Lanka
-
 Sweden
-
 Switzerland
-
 Syria
-
 Taiwan
-
 Tajikistan
-
 Tanzania
-
 Thailand
-
 Trinidad and Tobago
-
 Tunisia
-
 Turkey
-
 UAE
-
 Uganda
-
 Ukraine
-
 United Kingdom
-
United States
-
 Uruguay
-
 Uzbekistan
-
 Venezuela
-
 Vietnam
-
 Yemen
-
 Zambia
-
 Zimbabwe
- Forex
- Crypto












