

Will GS hold above $873.45 support amid renewed ETF selling?

Goldman Sachs (GS) stock is trading at $897.55, down 3.25% on the day. The price is currently positioned below its key moving averages, reflecting ongoing selling pressure across short- and long-term timeframes.
 905.54
932.40
Highlights
- ETFs executed $19.4 million in block sales of Goldman Sachs shares on October 27, contributing to substantial institutional outflows.
- Although more ETFs increased positions than sold, the scale of ETF outflows led trading activity and increased share supply.
- Goldman Sachs stock trades below key moving averages with strong seller pressure, an expected range of $873.45 to $921.65, and a 62% probability of further decline.
ETF block outflows amplify downside as institutional sentiment shifts
ETFs sold $19.4 million of Goldman Sachs shares in large blocks on October 27, amplifying institutional outflows and adding to the supply in the market, according to Gurufocus. Such significant block selling by ETFs can weigh on the asset's price by increasing short-term liquidity and amplifying downside momentum. Although the number of ETFs increasing positions exceeded those selling, the magnitude of the outflows dominated the day's trading dynamics.
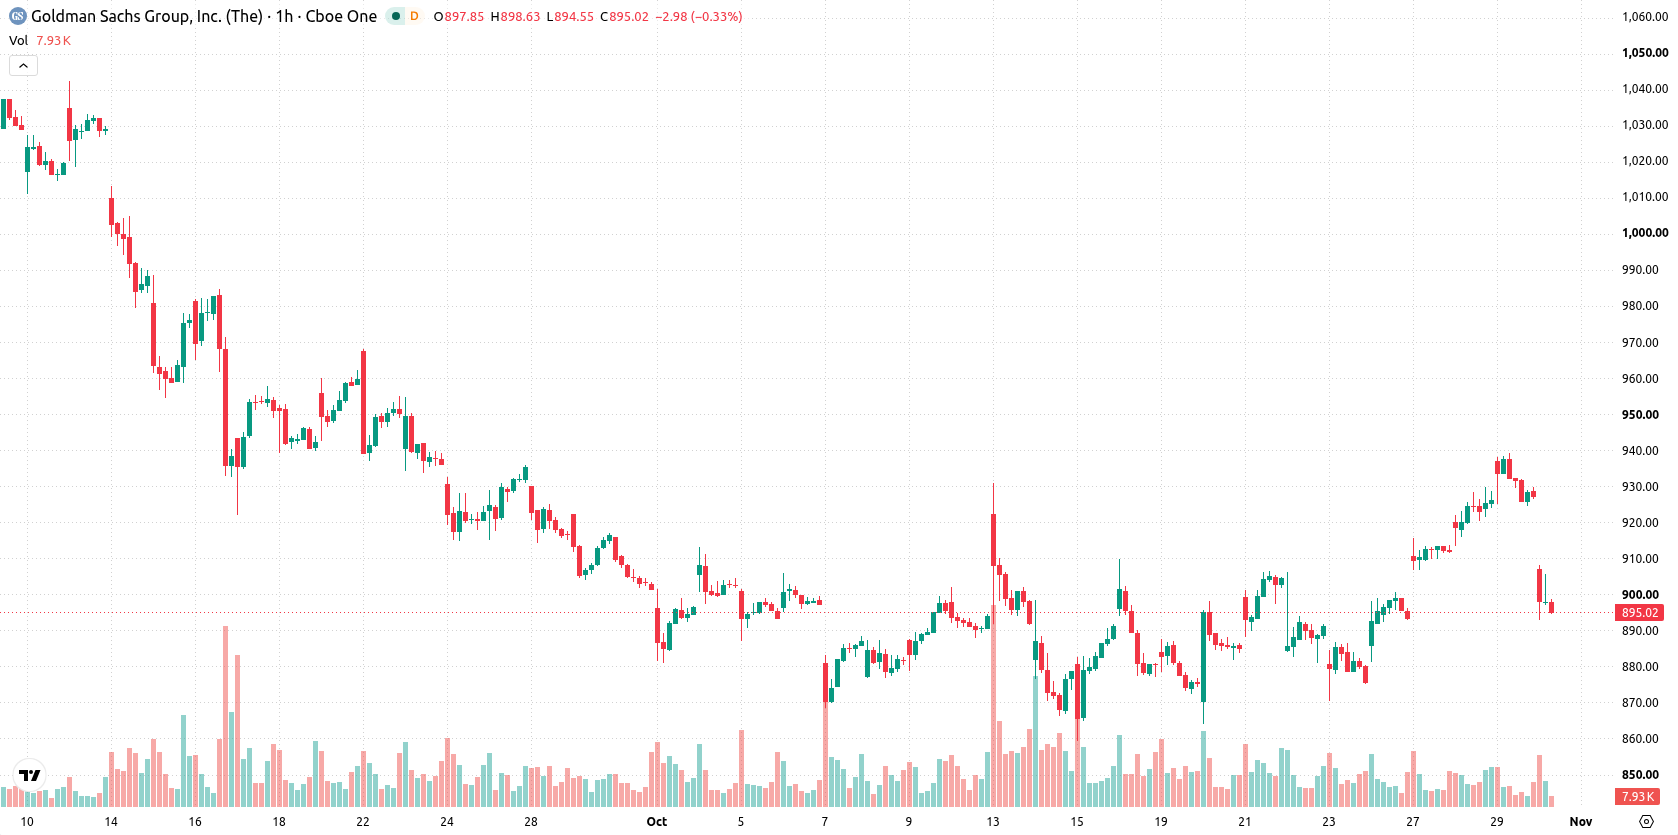
Divergent momentum signals amid resistance at major moving averages
GS is trading below the MA-20 at $922.51, MA-50 at $904.14, and the long-term MA-200 at $958.05. The Ichimoku Kijun level stands at $915.87 as immediate resistance. Momentum readings are mixed: MACD signals strong buy and ADX indicates a buy, while Stochastic RSI is in oversold territory. RSI and CCI both show buy signals, and Bull/Bear Power reveals dominance by buyers. Despite bullish signals from MACD and ADX, the divergence with oversold Stochastic RSI and weak intraday performance suggests conflicting technical signals.
Rebound risk fades as downside probabilities outweigh short-term upside
Over the next 2 to 3 trading days, GS is expected to remain in a sideways range between $873.45 and $921.65. The probability of a move higher is 38%, while a downward move has a 62% likelihood, making a sustained rebound less likely. If GS manages to close above the $915.87 resistance, it may test the upper end of the projected range. A break below $873.45, however, would open the door to steeper losses as selling pressure intensifies.
Earlier, analysts noted that Goldman Sachs shares were facing technical resistance and a higher probability of near-term downside, even as longer-term prospects remained constructive. The emergence of significant ETF-driven outflows and a failure to reclaim key moving averages now reinforce a downtrend bias, with traders advised to monitor support at $873.45 for potential renewed selling pressure.






Latest Goldman Sachs News




-
 Afghanistan
-
 Albania
-
 Algeria
-
 Angola
-
 Argentina
-
 Armenia
-
 Australia
-
 Austria
-
 Azerbaijan
-
 Bahamas
-
 Bahrain
-
 Bangladesh
-
 Belarus
-
 Belgium
-
 Bolivia
-
 Botswana
-
 Brazil
-
 Brunei
-
 Bulgaria
-
 Cambodia
-
 Cameroon
-
 Canada
-
 Chile
-
 China
-
 Colombia
-
 Congo
-
 Costa Rica
-
 Cote d'Ivoire
-
 Croatia
-
 Cuba
-
 Cyprus
-
 Czechia
-
 DR Congo
-
 Denmark
-
 Dominican Republic
-
 Ecuador
-
 Egypt
-
 El Salvador
-
 Estonia
-
 Eswatini
-
 Ethiopia
-
 Finland
-
 France
-
 Georgia
-
 Germany
-
 Ghana
-
 Greece
-
 Haiti
-
 Hong Kong
-
 Hungary
-
 India
-
 Indonesia
-
 Iran, Islamic republic
-
 Iraq
-
 Ireland
-
 Israel
-
 Italy
-
 Jamaica
-
 Japan
-
 Jordan
-
 Kazakhstan
-
 Kenya
-
 Korea
-
 Kuwait
-
 Kyrgyzstan
-
 Laos
-
 Latvia
-
 Lebanon
-
 Lesotho
-
 Libya
-
 Lithuania
-
 Luxembourg
-
 Madagascar
-
 Malaysia
-
 Malta
-
 Mauritius
-
 Mexico
-
 Moldova
-
 Mongolia
-
 Montenegro
-
 Morocco
-
 Mozambique
-
 Myanmar
-
 Namibia
-
 Nepal
-
 Netherlands
-
 New Zealand
-
 Nigeria
-
 North Macedonia
-
 Norway
-
 Oman
-
 Pakistan
-
 Palestine
-
 Panama
-
 Papua New Guinea
-
 Paraguay
-
 Peru
-
 Philippines
-
 Poland
-
 Portugal
-
 Puerto Rico
-
 Qatar
-
 Reunion
-
 Romania
-
 Rwanda
-
 Saudi Arabia
-
 Serbia
-
 Singapore
-
 Slovakia
-
 Slovenia
-
 Somalia
-
 South Africa
-
 Spain
-
 Sri Lanka
-
 Sweden
-
 Switzerland
-
 Syria
-
 Taiwan
-
 Tajikistan
-
 Tanzania
-
 Thailand
-
 Trinidad and Tobago
-
 Tunisia
-
 Turkey
-
 UAE
-
 Uganda
-
 Ukraine
-
 United Kingdom
-
United States
-
 Uruguay
-
 Uzbekistan
-
 Venezuela
-
 Vietnam
-
 Yemen
-
 Zambia
-
 Zimbabwe
- Forex
- Crypto












