

AST SpaceMobile shares technical analysis: Support pressure builds around $38.27

AST SpaceMobile (ASTS) stock is trading at $40.97, down 4.98% on the day. The price currently sits below its key short-term averages but remains above some medium-term levels, suggesting a mixed technical configuration.
 41.20
44.82
Highlights
- AST SpaceMobile faces securities class action lawsuits alleging false statements about its capital and liquidity, raising regulatory and legal risks.
- Vanguard Capital Management increased its stake in AST SpaceMobile by 22.5% to 15.3 million shares as the company plans Japan satellite service with Rakuten in late 2026.
- Shares of AST SpaceMobile traded sharply lower, showing strong intraday selling pressure and a 72% probability of continued downside, with an expected price range of $38.27 to $43.67 for the next 2 to 3 days.
Litigation risk rises as institutional ownership and growth plans diverge
Several law firms have filed securities class action lawsuits against AST SpaceMobile, Inc., alleging material misstatements regarding the company’s capital and liquidity position, a development that, according to Financialcontent, heightens regulatory and legal risk and weighs on market sentiment. This increase in risk has likely contributed to investor caution. Meanwhile, Stocktwits reported that Vanguard Capital Management has raised its stake in AST SpaceMobile by 22.5% to 15.3 million shares, signaling ongoing institutional interest, and the company has announced plans to launch commercial satellite service in Japan with Rakuten in late 2026, pointing to longer-term strategic growth.
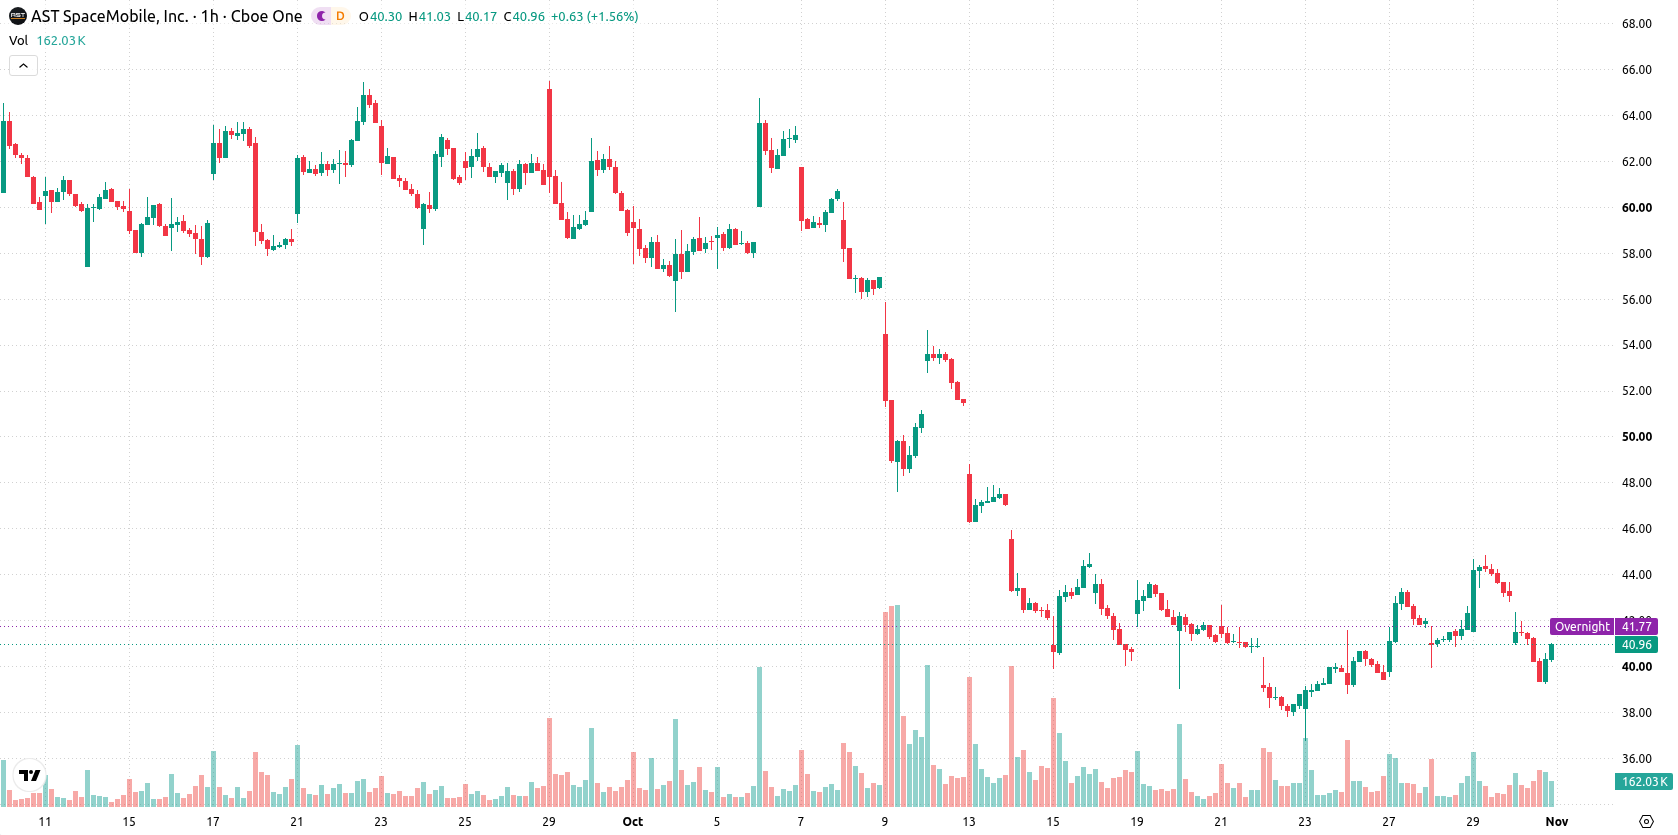
Bearish momentum as resistance caps price and signals worsen
ASTS is trading below the MA-20 at $42.05 but remains above the MA-50 at $40.89 on the hourly chart, while staying well below the long-term MA-200 at $77.5. The Ichimoku Kijun level at $42.03 stands as the nearest resistance. Momentum readings are mixed: MACD is neutral, while ADX signals a Sell. RSI at 45.76 and CCI both register Sell, while Stochastic RSI is neutral. Bull/Bear Power readings indicate oversold conditions and continued seller dominance intraday, supported by negative signals from the Awesome Oscillator.
Downside risk amplified as volatility bands tighten
Over the next 2–3 trading days, ASTS is expected to trade within a volatility band between $38.27 and $43.67, following recent high volatility and sharp declines. There is a 28% probability of an upward move against a 72% likelihood of further downside, supporting a bearish outlook. A breakout above the $42.03 resistance could improve sentiment, while a drop below $38.27 would reinforce the current downtrend and expose the stock to additional downside risk.
Earlier, analysts noted that AST SpaceMobile was experiencing persistent bearish momentum amid legal and operational uncertainties. The latest developments reinforce this negative outlook, with increased legal risk and ongoing downside pressure highlighting $38.27 as a critical support level for traders to monitor in the near term.









-
 Afghanistan
-
 Albania
-
 Algeria
-
 Angola
-
 Argentina
-
 Armenia
-
 Australia
-
 Austria
-
 Azerbaijan
-
 Bahamas
-
 Bahrain
-
 Bangladesh
-
 Belarus
-
 Belgium
-
 Bolivia
-
 Botswana
-
 Brazil
-
 Brunei
-
 Bulgaria
-
 Cambodia
-
 Cameroon
-
 Canada
-
 Chile
-
 China
-
 Colombia
-
 Congo
-
 Costa Rica
-
 Cote d'Ivoire
-
 Croatia
-
 Cuba
-
 Cyprus
-
 Czechia
-
 DR Congo
-
 Denmark
-
 Dominican Republic
-
 Ecuador
-
 Egypt
-
 El Salvador
-
 Estonia
-
 Eswatini
-
 Ethiopia
-
 Finland
-
 France
-
 Georgia
-
 Germany
-
 Ghana
-
 Greece
-
 Haiti
-
 Hong Kong
-
 Hungary
-
 India
-
 Indonesia
-
 Iran, Islamic republic
-
 Iraq
-
 Ireland
-
 Israel
-
 Italy
-
 Jamaica
-
 Japan
-
 Jordan
-
 Kazakhstan
-
 Kenya
-
 Korea
-
 Kuwait
-
 Kyrgyzstan
-
 Laos
-
 Latvia
-
 Lebanon
-
 Lesotho
-
 Libya
-
 Lithuania
-
 Luxembourg
-
 Madagascar
-
 Malaysia
-
 Malta
-
 Mauritius
-
 Mexico
-
 Moldova
-
 Mongolia
-
 Montenegro
-
 Morocco
-
 Mozambique
-
 Myanmar
-
 Namibia
-
 Nepal
-
 Netherlands
-
 New Zealand
-
 Nigeria
-
 North Macedonia
-
 Norway
-
 Oman
-
 Pakistan
-
 Palestine
-
 Panama
-
 Papua New Guinea
-
 Paraguay
-
 Peru
-
 Philippines
-
 Poland
-
 Portugal
-
 Puerto Rico
-
 Qatar
-
 Reunion
-
 Romania
-
 Rwanda
-
 Saudi Arabia
-
 Serbia
-
 Singapore
-
 Slovakia
-
 Slovenia
-
 Somalia
-
 South Africa
-
 Spain
-
 Sri Lanka
-
 Sweden
-
 Switzerland
-
 Syria
-
 Taiwan
-
 Tajikistan
-
 Tanzania
-
 Thailand
-
 Trinidad and Tobago
-
 Tunisia
-
 Turkey
-
 UAE
-
 Uganda
-
 Ukraine
-
 United Kingdom
-
United States
-
 Uruguay
-
 Uzbekistan
-
 Venezuela
-
 Vietnam
-
 Yemen
-
 Zambia
-
 Zimbabwe
- Forex
- Crypto












