

National Grid shares technical analysis: Price holds above GBX1,240 support with mixed momentum

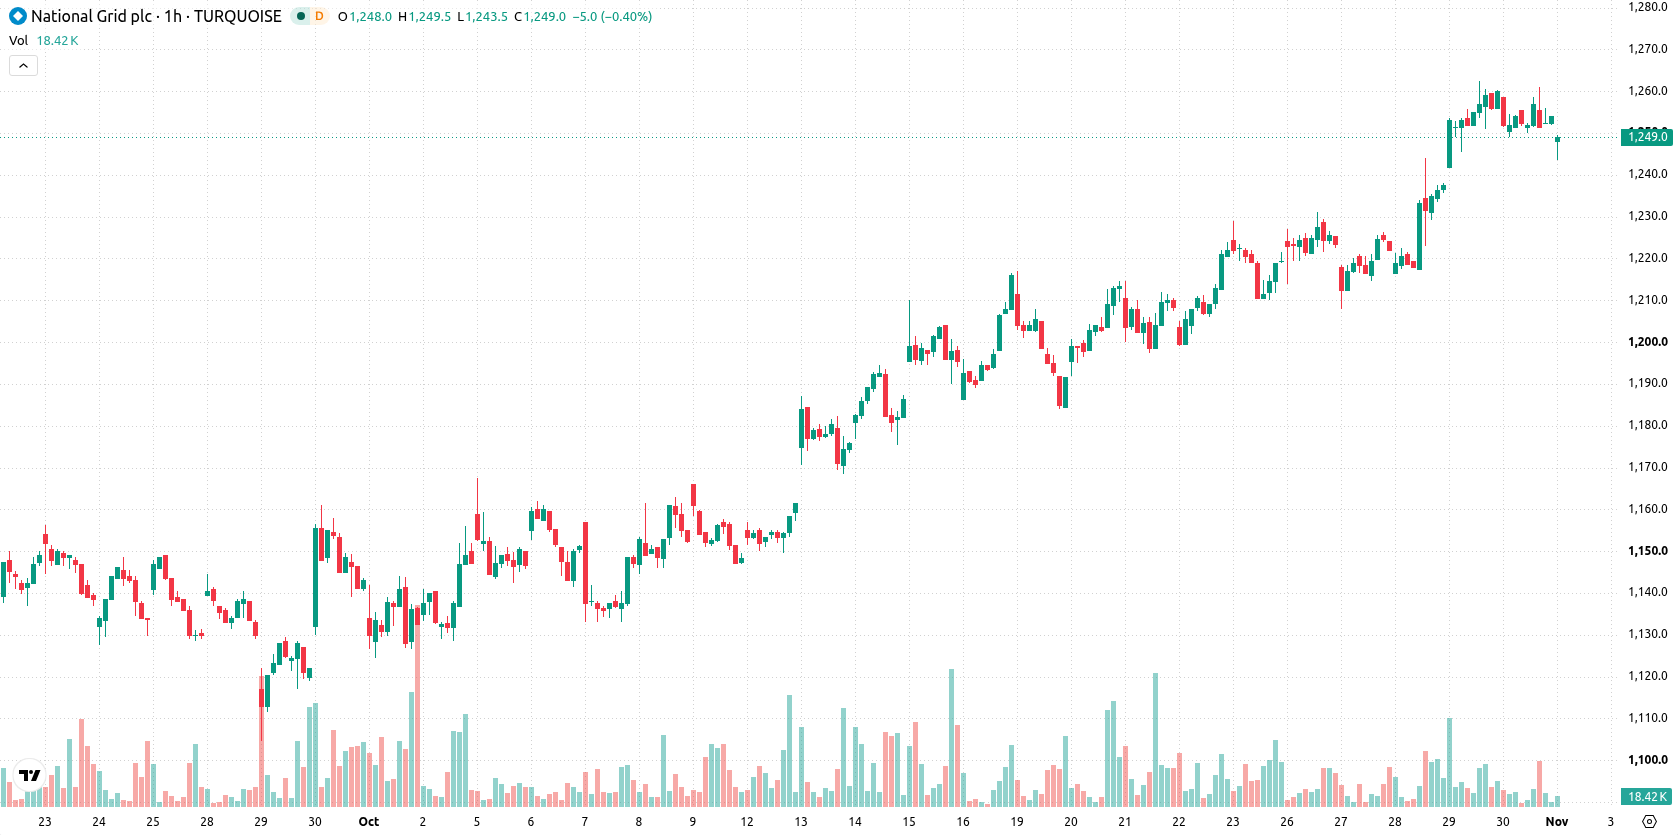
National Grid (NG) stock is trading at GBX1,249 after a modest daily decline. The price sits below its short-term moving average but remains above medium- and long-term averages, reflecting mixed momentum.
 1256.00
1262.50
Highlights
- The price trades below the short-term average but stays above the medium- and long-term averages on intraday and daily charts.
- Short-term indicators are mixed, with strong buy signals from MACD but bearish momentum from RSI and oscillators pointing to oversold conditions.
- The anticipated trading range is GBX1,224 to GBX1,273 over the next few days, with a 68% probability of upward price movement.
Bullish MACD momentum diverges from oversold oscillator signals
On the intraday chart, the price is trading below the MA-20 but maintains its position above the MA-50 and sits well above the long-term MA-200. The Ichimoku Kijun level at GBX1,240 acts as key immediate support. Momentum indicators present a mixed picture: MACD is on a strong buy signal, ADX leans buy, while RSI points to a sell. Oversold readings from Stoch RSI, CCI, and Bull/Bear Power indicate continued seller dominance during the session. The session saw a gap down of 6 points and closed near the high, despite overall low volatility, highlighting a divergence between strong MACD momentum and cautious readings from other oscillators.
Sideways movement likely as price compresses within technical band
In the coming days, trading is likely to remain within the GBX1,224 to GBX1,273 range, reflecting a typical volatility band relative to current levels. The forecast assigns a 68% probability to upward price movement and a 32% chance of a decline. The baseline scenario expects sideways price oscillation unless resistance is breached decisively or support at or near GBX1,240 fails.
Earlier, analysts noted that National Grid's long-term investment strategy and constructive technical momentum were supporting a positive medium-term outlook. The latest mixed momentum signals and seller dominance on the intraday chart suggest that traders should monitor the GBX1,240 support level closely, as a breach could prompt further downside within the prevailing trading range.









-
 Afghanistan
-
 Albania
-
 Algeria
-
 Angola
-
 Argentina
-
 Armenia
-
 Australia
-
 Austria
-
 Azerbaijan
-
 Bahamas
-
 Bahrain
-
 Bangladesh
-
 Belarus
-
 Belgium
-
 Bolivia
-
 Botswana
-
 Brazil
-
 Brunei
-
 Bulgaria
-
 Cambodia
-
 Cameroon
-
 Canada
-
 Chile
-
 China
-
 Colombia
-
 Congo
-
 Costa Rica
-
 Cote d'Ivoire
-
 Croatia
-
 Cuba
-
 Cyprus
-
 Czechia
-
 DR Congo
-
 Denmark
-
 Dominican Republic
-
 Ecuador
-
 Egypt
-
 El Salvador
-
 Estonia
-
 Eswatini
-
 Ethiopia
-
 Finland
-
 France
-
 Georgia
-
 Germany
-
 Ghana
-
 Greece
-
 Haiti
-
 Hong Kong
-
 Hungary
-
 India
-
 Indonesia
-
 Iran, Islamic republic
-
 Iraq
-
 Ireland
-
 Israel
-
 Italy
-
 Jamaica
-
 Japan
-
 Jordan
-
 Kazakhstan
-
 Kenya
-
 Korea
-
 Kuwait
-
 Kyrgyzstan
-
 Laos
-
 Latvia
-
 Lebanon
-
 Lesotho
-
 Libya
-
 Lithuania
-
 Luxembourg
-
 Madagascar
-
 Malaysia
-
 Malta
-
 Mauritius
-
 Mexico
-
 Moldova
-
 Mongolia
-
 Montenegro
-
 Morocco
-
 Mozambique
-
 Myanmar
-
 Namibia
-
 Nepal
-
 Netherlands
-
 New Zealand
-
 Nigeria
-
 North Macedonia
-
 Norway
-
 Oman
-
 Pakistan
-
 Palestine
-
 Panama
-
 Papua New Guinea
-
 Paraguay
-
 Peru
-
 Philippines
-
 Poland
-
 Portugal
-
 Puerto Rico
-
 Qatar
-
 Reunion
-
 Romania
-
 Rwanda
-
 Saudi Arabia
-
 Serbia
-
 Singapore
-
 Slovakia
-
 Slovenia
-
 Somalia
-
 South Africa
-
 Spain
-
 Sri Lanka
-
 Sweden
-
 Switzerland
-
 Syria
-
 Taiwan
-
 Tajikistan
-
 Tanzania
-
 Thailand
-
 Trinidad and Tobago
-
 Tunisia
-
 Turkey
-
 UAE
-
 Uganda
-
 Ukraine
-
 United Kingdom
-
United States
-
 Uruguay
-
 Uzbekistan
-
 Venezuela
-
 Vietnam
-
 Yemen
-
 Zambia
-
 Zimbabwe
- Forex
- Crypto












