

Microsoft stock outlook: Inside resistance test amid weak momentum signals

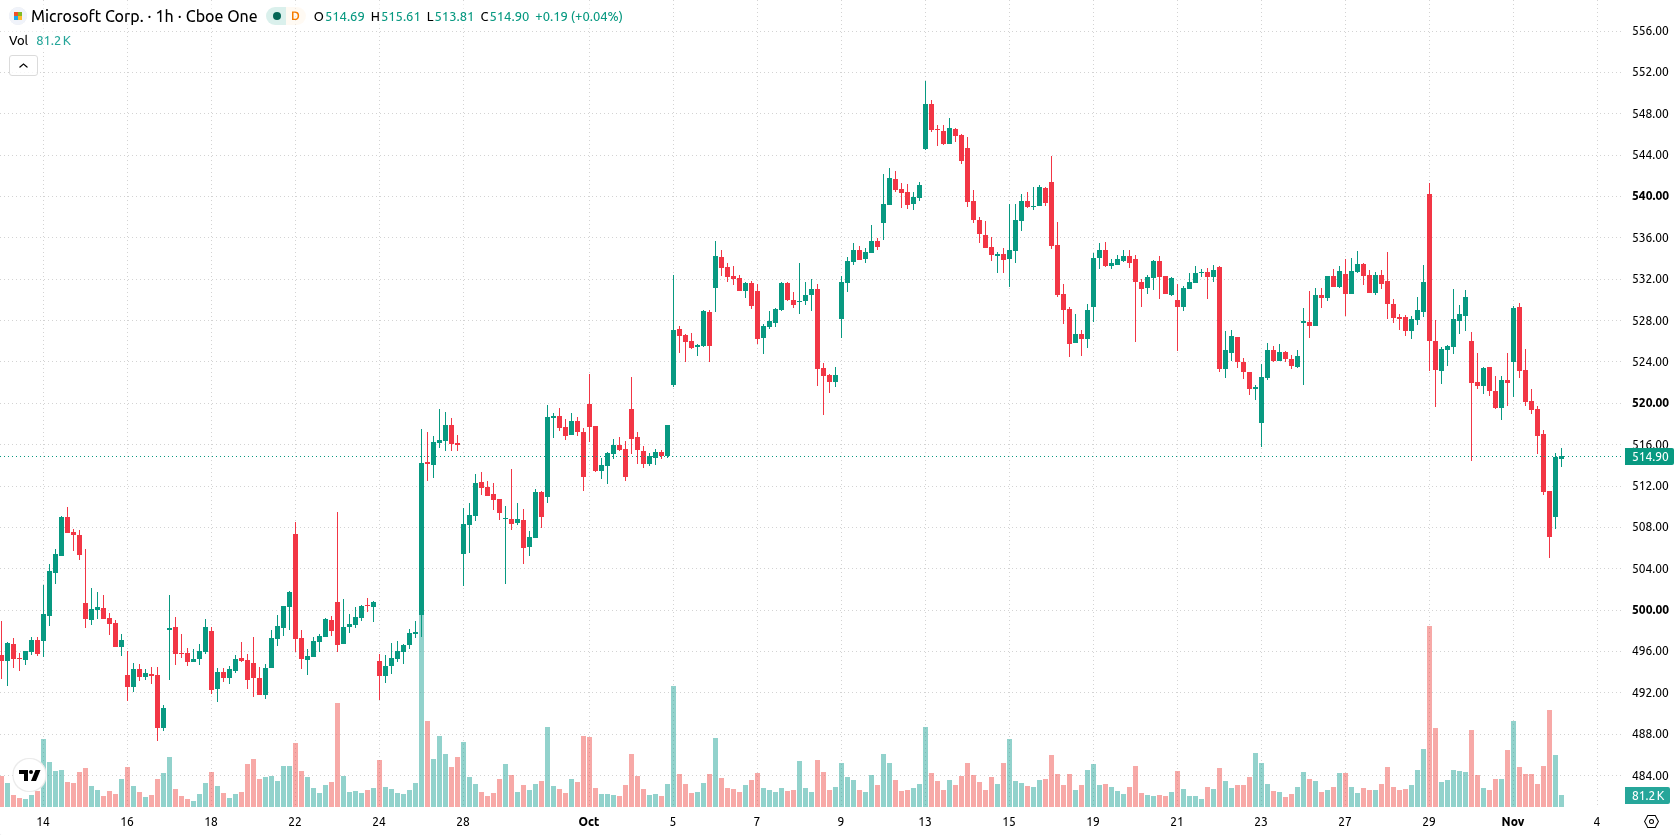
Microsoft (MSFT) stock is trading at $517.06, higher by 1.98% on the day, showing substantial volatility and currently sitting mid-range in intraday price action. The stock remains under pressure from shorter-term moving averages but continues to hold well above longer-term trends.
 538.19
559.07
Highlights
- Microsoft reported fiscal Q1 2027 revenue up 19% year over year to $92.3 billion and adjusted earnings per share of $4.89.
- Signed multi-year cloud contracts total $677 billion, with new AI partnerships in enterprise verticals expanding future revenue streams.
- Microsoft stock trades below key short- and medium-term moving averages with bearish momentum, expected in the $500.32 to $528.54 range over the next few days.
Cloud and AI demand drive revenue surge and contract pipeline
Microsoft’s fiscal Q1 2027 results showed revenue rising 19% year over year to $92.3 billion and adjusted earnings per share of $4.89, underscoring surging demand for its cloud and AI businesses, according to Yahoo Finance. The company’s $677 billion in signed multi-year cloud contracts, as reported by Seeking Alpha, highlights a robust pipeline of future recurring revenue and investors’ confidence in long-term growth. Additional momentum comes from an expanded AI partnership with The Estée Lauder Companies and a deepened collaboration with Lumen to advance Azure and AI workloads, initiatives that broaden Microsoft’s reach across new enterprise verticals.
Short-term sell signals as oversold momentum meets key resistance
On the hourly chart, MSFT is below its MA-20 and MA-50, indicating seller control in the short and medium term, while remaining above the MA-200, which confirms ongoing long-term structural support. The Ichimoku Kijun level at $523.12 is acting as immediate resistance. MACD and ADX are both showing sell signals, while momentum oscillators including RSI, Stoch RSI, and CCI are deeply oversold, signaling the potential for an upside rebound or exhaustion of sellers. Bull/Bear Power remains negative and the Awesome Oscillator also favors sellers, highlighting continuing intraday pressure.
Consolidation expected as downward risk outweighs breakout odds
In the short term, MSFT is expected to trade within a range of $500.32 to $528.54, reflecting its recent volatility band relative to current levels. While the probability of an upward move remains very low, the risk of further downside persists, making an upward breakout less likely. The baseline scenario sees price consolidating within this corridor, though a break above $523.12 could open the way toward the upper end of the band, while a move below $500.32 would likely trigger further selling momentum.
Earlier, analysts noted that Microsoft's long-term outlook would increasingly depend on its cloud and AI-driven businesses, even as technical signals showed mixed momentum. The current analysis adds evidence of this ongoing transition, but with the stock facing sustained short-term selling pressure, the pivotal area to watch is a potential move above $523.12 or below $500.32 for confirmation of the next directional trend.






Latest Microsoft News





-
 Afghanistan
-
 Albania
-
 Algeria
-
 Angola
-
 Argentina
-
 Armenia
-
 Australia
-
 Austria
-
 Azerbaijan
-
 Bahamas
-
 Bahrain
-
 Bangladesh
-
 Belarus
-
 Belgium
-
 Bolivia
-
 Botswana
-
 Brazil
-
 Brunei
-
 Bulgaria
-
 Cambodia
-
 Cameroon
-
 Canada
-
 Chile
-
 China
-
 Colombia
-
 Congo
-
 Costa Rica
-
 Cote d'Ivoire
-
 Croatia
-
 Cuba
-
 Cyprus
-
 Czechia
-
 DR Congo
-
 Denmark
-
 Dominican Republic
-
 Ecuador
-
 Egypt
-
 El Salvador
-
 Estonia
-
 Eswatini
-
 Ethiopia
-
 Finland
-
 France
-
 Georgia
-
 Germany
-
 Ghana
-
 Greece
-
 Haiti
-
 Hong Kong
-
 Hungary
-
 India
-
 Indonesia
-
 Iran, Islamic republic
-
 Iraq
-
 Ireland
-
 Israel
-
 Italy
-
 Jamaica
-
 Japan
-
 Jordan
-
 Kazakhstan
-
 Kenya
-
 Korea
-
 Kuwait
-
 Kyrgyzstan
-
 Laos
-
 Latvia
-
 Lebanon
-
 Lesotho
-
 Libya
-
 Lithuania
-
 Luxembourg
-
 Madagascar
-
 Malaysia
-
 Malta
-
 Mauritius
-
 Mexico
-
 Moldova
-
 Mongolia
-
 Montenegro
-
 Morocco
-
 Mozambique
-
 Myanmar
-
 Namibia
-
 Nepal
-
 Netherlands
-
 New Zealand
-
 Nigeria
-
 North Macedonia
-
 Norway
-
 Oman
-
 Pakistan
-
 Palestine
-
 Panama
-
 Papua New Guinea
-
 Paraguay
-
 Peru
-
 Philippines
-
 Poland
-
 Portugal
-
 Puerto Rico
-
 Qatar
-
 Reunion
-
 Romania
-
 Rwanda
-
 Saudi Arabia
-
 Serbia
-
 Singapore
-
 Slovakia
-
 Slovenia
-
 Somalia
-
 South Africa
-
 Spain
-
 Sri Lanka
-
 Sweden
-
 Switzerland
-
 Syria
-
 Taiwan
-
 Tajikistan
-
 Tanzania
-
 Thailand
-
 Trinidad and Tobago
-
 Tunisia
-
 Turkey
-
 UAE
-
 Uganda
-
 Ukraine
-
 United Kingdom
-
United States
-
 Uruguay
-
 Uzbekistan
-
 Venezuela
-
 Vietnam
-
 Yemen
-
 Zambia
-
 Zimbabwe
- Forex
- Crypto












