

What's behind Builders FirstSource's latest stock pullback?

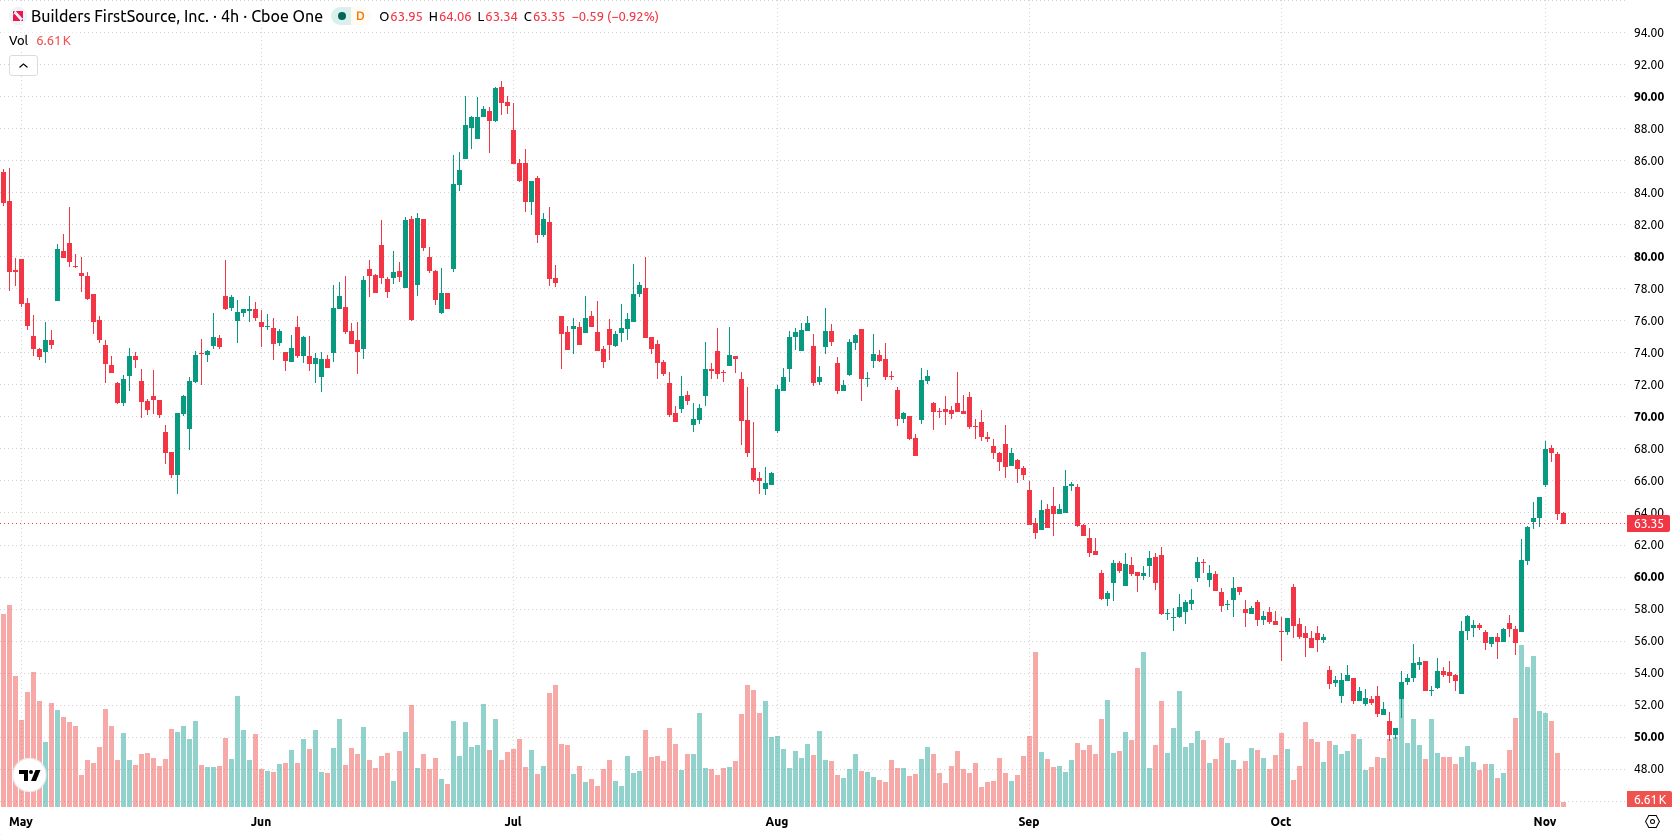
Builders FirstSource (BLDR) dropped 6.7% as technical pressure and overbought oscillators triggered renewed selling. The down move is supported by the persistence of a bearish long-term structure, with the price remaining below the 200-day moving average and clearing key short- and medium-term supports.
 67.85
68.67
Highlights
- Shares of Builders FirstSource closed at $63.26, falling 6.7% with intraday volatility at 6.23%.
- The stock remains below its long-term moving average, indicating a bearish trend persists despite recent short- and medium-term strength.
- Oscillators are overbought, with next five sessions projected between $56.64 to $69.88 and a baseline scenario of sideways movement.
Mixed momentum and intraday pressure alongside overbought technicals
Builders FirstSource is trading above both its 20-day and 50-day moving averages at $55.93 and $59.23, but remains below the 200-day moving average at $79.9. This structure points to sustained short- and medium-term buoyancy, though a bearish long-term trend persists, with immediate support seen at the 50-day ($59.23) and resistance near today’s low of $63.56. Momentum indicators show mixed signals: the Moving Average Convergence Divergence (MACD) reads neutral, while the Average Directional Index (ADX) implies trend strength. The Relative Strength Index (RSI), Stochastic RSI, and Commodity Channel Index (CCI) are all in their overbought zones, suggesting elevated risk of a near-term pullback. Bull/Bear Power (BBP) indicates buyers dominate intraday momentum, and the Awesome Oscillator affirms this with a buy signal. The stock last traded at $63.26, declining $4.54 or 6.7% on the session, after a downside gap of 0.56%. Price is positioned near the low of today’s range, with intraday volatility at 6.23%. The intraday tone is under pressure following the initial open, with possible overheating indicated by overbought oscillators.
Earlier, analysts noted that Builders FirstSource was showing short-term resilience despite an overall bearish longer-term trend. The current decline reinforces the importance of monitoring key support at $56.64, as a break below this level could signal additional downside risk in the days ahead.






Latest Builders FirstSource News



-
 Afghanistan
-
 Albania
-
 Algeria
-
 Angola
-
 Argentina
-
 Armenia
-
 Australia
-
 Austria
-
 Azerbaijan
-
 Bahamas
-
 Bahrain
-
 Bangladesh
-
 Belarus
-
 Belgium
-
 Bolivia
-
 Botswana
-
 Brazil
-
 Brunei
-
 Bulgaria
-
 Cambodia
-
 Cameroon
-
 Canada
-
 Chile
-
 China
-
 Colombia
-
 Congo
-
 Costa Rica
-
 Cote d'Ivoire
-
 Croatia
-
 Cuba
-
 Cyprus
-
 Czechia
-
 DR Congo
-
 Denmark
-
 Dominican Republic
-
 Ecuador
-
 Egypt
-
 El Salvador
-
 Estonia
-
 Eswatini
-
 Ethiopia
-
 Finland
-
 France
-
 Georgia
-
 Germany
-
 Ghana
-
 Greece
-
 Haiti
-
 Hong Kong
-
 Hungary
-
 India
-
 Indonesia
-
 Iran, Islamic republic
-
 Iraq
-
 Ireland
-
 Israel
-
 Italy
-
 Jamaica
-
 Japan
-
 Jordan
-
 Kazakhstan
-
 Kenya
-
 Korea
-
 Kuwait
-
 Kyrgyzstan
-
 Laos
-
 Latvia
-
 Lebanon
-
 Lesotho
-
 Libya
-
 Lithuania
-
 Luxembourg
-
 Madagascar
-
 Malaysia
-
 Malta
-
 Mauritius
-
 Mexico
-
 Moldova
-
 Mongolia
-
 Montenegro
-
 Morocco
-
 Mozambique
-
 Myanmar
-
 Namibia
-
 Nepal
-
 Netherlands
-
 New Zealand
-
 Nigeria
-
 North Macedonia
-
 Norway
-
 Oman
-
 Pakistan
-
 Palestine
-
 Panama
-
 Papua New Guinea
-
 Paraguay
-
 Peru
-
 Philippines
-
 Poland
-
 Portugal
-
 Puerto Rico
-
 Qatar
-
 Reunion
-
 Romania
-
 Rwanda
-
 Saudi Arabia
-
 Serbia
-
 Singapore
-
 Slovakia
-
 Slovenia
-
 Somalia
-
 South Africa
-
 Spain
-
 Sri Lanka
-
 Sweden
-
 Switzerland
-
 Syria
-
 Taiwan
-
 Tajikistan
-
 Tanzania
-
 Thailand
-
 Trinidad and Tobago
-
 Tunisia
-
 Turkey
-
 UAE
-
 Uganda
-
 Ukraine
-
 United Kingdom
-
United States
-
 Uruguay
-
 Uzbekistan
-
 Venezuela
-
 Vietnam
-
 Yemen
-
 Zambia
-
 Zimbabwe
- Forex
- Crypto












