

Brown Forman stock falls nearly 4% as downside price momentum persists despite supportive technicals

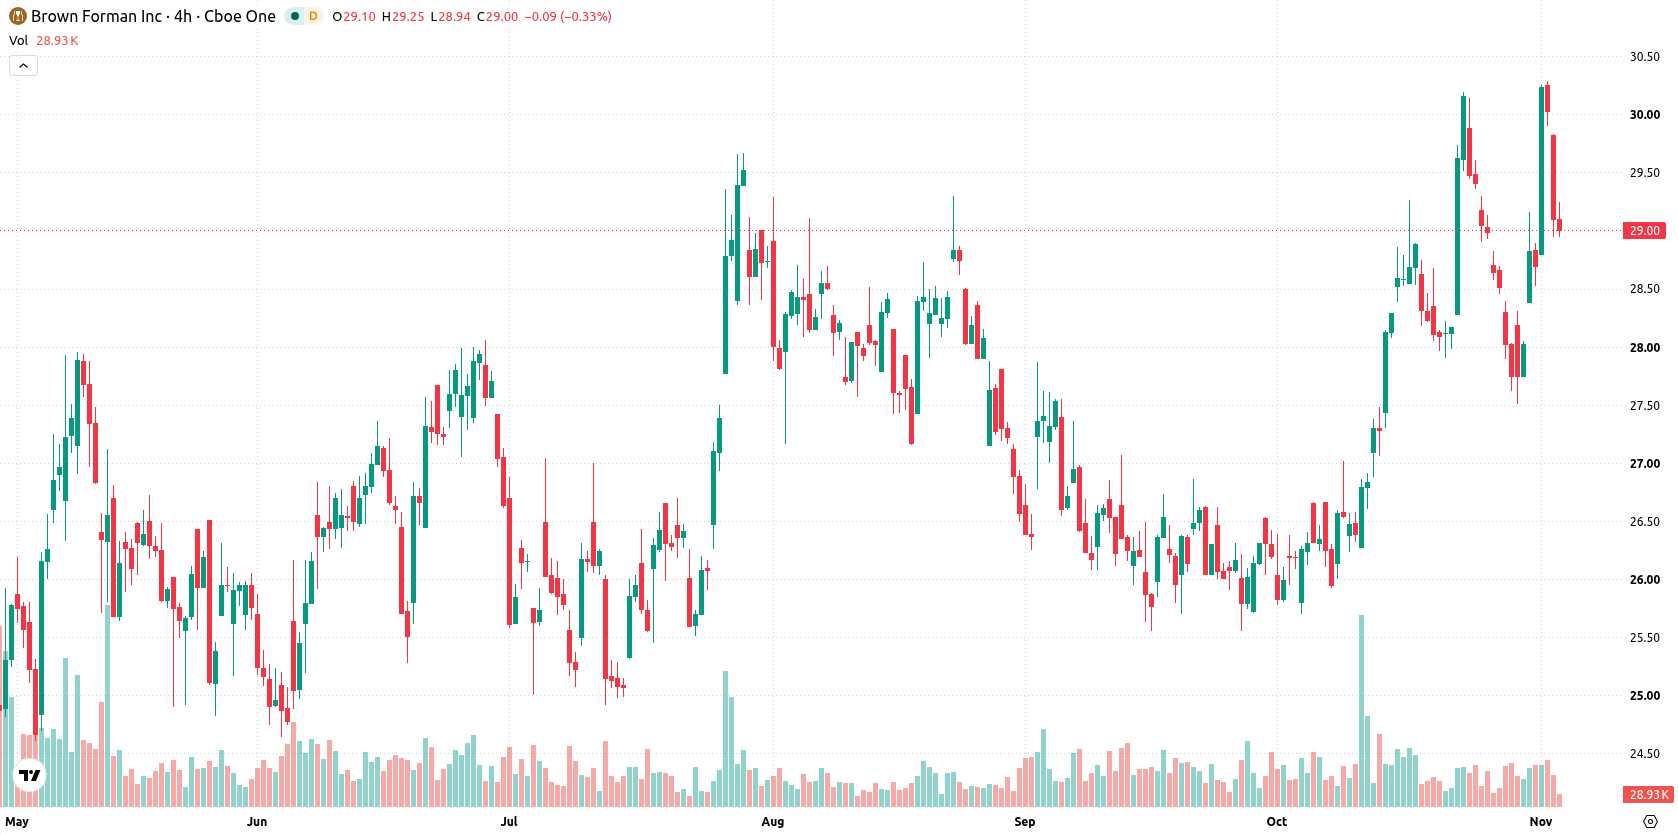
Brown-Forman Corporation (BFB) fell 3.63% as downside price momentum took hold following a lower open and persistent intraday pressure. The pullback is occurring against a still-constructive technical backdrop, with the stock trading above key moving averages and buyers maintaining a broader advantage.
 29.81
30.29
Highlights
- Shares of Brown Forman closed at $28.94, down 3.63% after opening with a 1.03% downside gap and testing session lows.
- The stock remains in a bullish technical alignment and is trading above its 20-day, 50-day, and 200-day moving averages.
- Brown Forman is projected to trade in a $27.55 to $30.33 range over the next five days, with an overbought reading indicating possible near-term correction risk despite continued longer-term buying interest.
Bullish technicals persist as momentum signals favor buyers
Brown Forman is trading above its 20-day, 50-day, and 200-day moving averages ($28.06, $27.19, and $27.05 respectively), indicating a constructive short-, medium-, and long-term technical setup. The near-term ceiling is at $28.95 and the near-term floor sits at the 20-day average of $28.06, while the bullish alignment between the 50- and 200-day moving averages confirms prevailing longer-term strength. Momentum for the stock is supported by a positive MACD and a firm ADX, signaling continued buying interest. The Relative Strength Index (RSI) and the Stochastic RSI are both neutral, showing no extreme buying or selling pressure, while the Commodity Channel Index (CCI) is currently in the overbought zone. Bull/Bear Power (BBP) is positive, confirming buyers dominate intraday momentum, with Awesome Oscillator (AO) readings remaining neutral.
Previously it was reported that Brown-Forman experienced a decisive bullish breakout, supported by strong technical momentum and a constructive trend across key indicators. The current analysis adds nuance by highlighting near-term downside pressure within an overall bullish framework, with the $28.95 resistance and $28.06 support now serving as important levels that may define the stock's trajectory in the days ahead.






Latest Brown Forman News




-
 Afghanistan
-
 Albania
-
 Algeria
-
 Angola
-
 Argentina
-
 Armenia
-
 Australia
-
 Austria
-
 Azerbaijan
-
 Bahamas
-
 Bahrain
-
 Bangladesh
-
 Belarus
-
 Belgium
-
 Bolivia
-
 Botswana
-
 Brazil
-
 Brunei
-
 Bulgaria
-
 Cambodia
-
 Cameroon
-
 Canada
-
 Chile
-
 China
-
 Colombia
-
 Congo
-
 Costa Rica
-
 Cote d'Ivoire
-
 Croatia
-
 Cuba
-
 Cyprus
-
 Czechia
-
 DR Congo
-
 Denmark
-
 Dominican Republic
-
 Ecuador
-
 Egypt
-
 El Salvador
-
 Estonia
-
 Eswatini
-
 Ethiopia
-
 Finland
-
 France
-
 Georgia
-
 Germany
-
 Ghana
-
 Greece
-
 Haiti
-
 Hong Kong
-
 Hungary
-
 India
-
 Indonesia
-
 Iran, Islamic republic
-
 Iraq
-
 Ireland
-
 Israel
-
 Italy
-
 Jamaica
-
 Japan
-
 Jordan
-
 Kazakhstan
-
 Kenya
-
 Korea
-
 Kuwait
-
 Kyrgyzstan
-
 Laos
-
 Latvia
-
 Lebanon
-
 Lesotho
-
 Libya
-
 Lithuania
-
 Luxembourg
-
 Madagascar
-
 Malaysia
-
 Malta
-
 Mauritius
-
 Mexico
-
 Moldova
-
 Mongolia
-
 Montenegro
-
 Morocco
-
 Mozambique
-
 Myanmar
-
 Namibia
-
 Nepal
-
 Netherlands
-
 New Zealand
-
 Nigeria
-
 North Macedonia
-
 Norway
-
 Oman
-
 Pakistan
-
 Palestine
-
 Panama
-
 Papua New Guinea
-
 Paraguay
-
 Peru
-
 Philippines
-
 Poland
-
 Portugal
-
 Puerto Rico
-
 Qatar
-
 Reunion
-
 Romania
-
 Rwanda
-
 Saudi Arabia
-
 Serbia
-
 Singapore
-
 Slovakia
-
 Slovenia
-
 Somalia
-
 South Africa
-
 Spain
-
 Sri Lanka
-
 Sweden
-
 Switzerland
-
 Syria
-
 Taiwan
-
 Tajikistan
-
 Tanzania
-
 Thailand
-
 Trinidad and Tobago
-
 Tunisia
-
 Turkey
-
 UAE
-
 Uganda
-
 Ukraine
-
 United Kingdom
-
United States
-
 Uruguay
-
 Uzbekistan
-
 Venezuela
-
 Vietnam
-
 Yemen
-
 Zambia
-
 Zimbabwe
- Forex
- Crypto












