

Why are Nebius Group shares down 5.5% today?

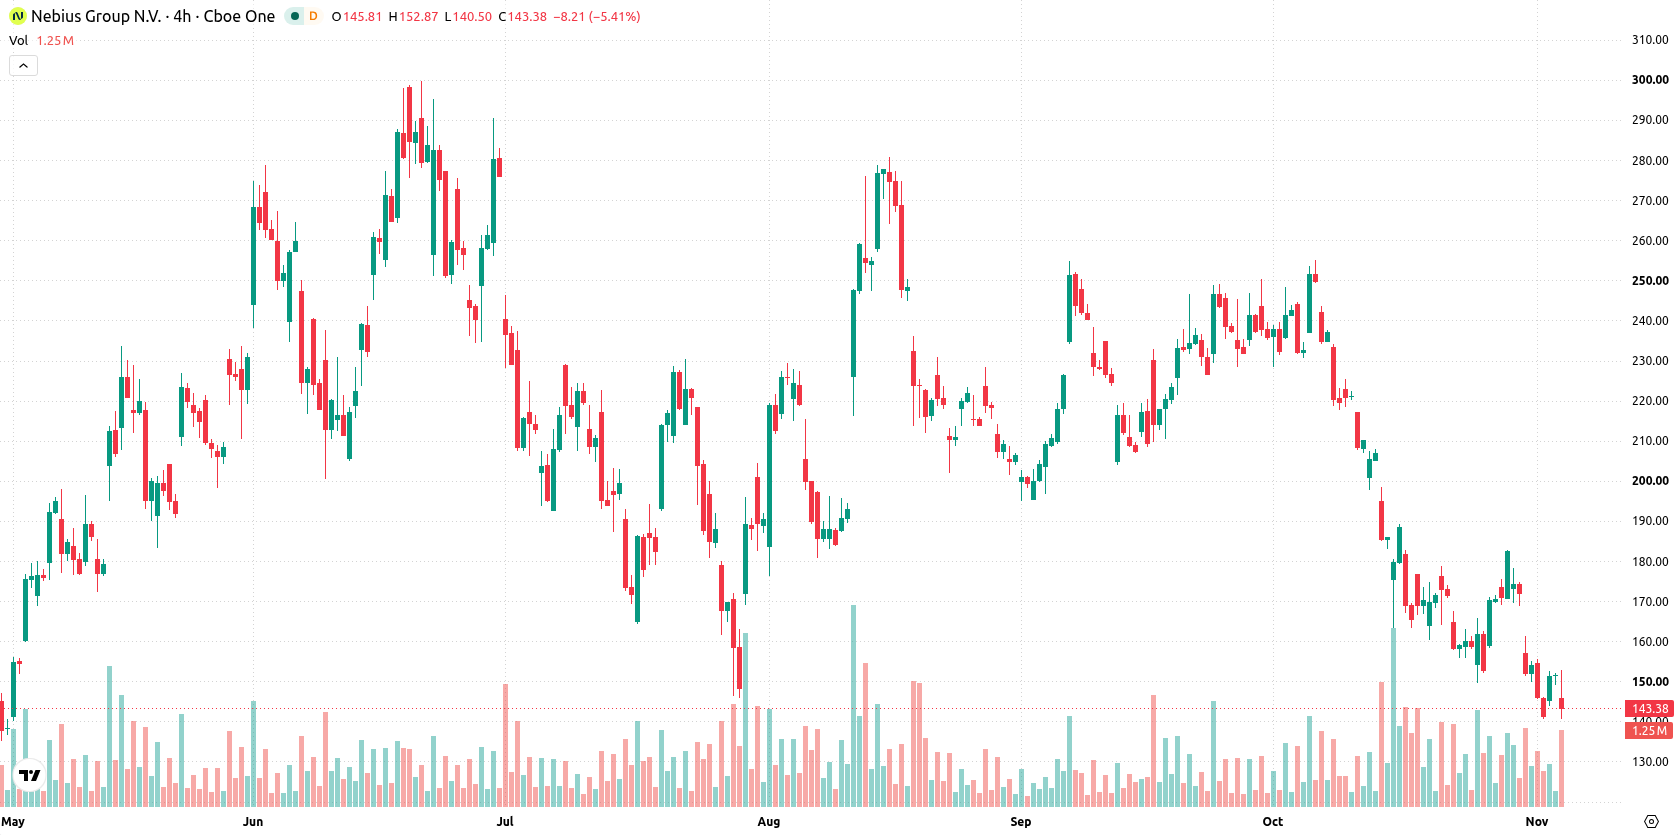
Nebius Group N.V. (NBIS) fell 5.51% after a surge in selling pressured shares following recent technical rebound and dip-buying in the wake of a steep monthly decline. The move is reinforced by the stock trading well below its 20-, 50-, and 200-day moving averages, signaling persistent bearish sentiment.
 152.88
177.94
Highlights
- Nebius Group stock recovered some ground after a 35% monthly drop as it prepares to report third-quarter 2026 earnings with a projected per-share loss.
- Sumitomo Mitsui Trust Group reduced its Nebius Group holdings by 5.3%, and the company introduced live GPU spot pricing, reserve auctions, and capacity rebates for AI cloud customers in Europe.
- Shares trade near $143.29, below key support, with sellers in control and a likely price range of $124.62 to $161.96 over five days.
Analyst optimism persists as institutional outflows and new AI offerings weigh
Nebius Group, an AI-focused cloud infrastructure company, recently experienced technical rebound and dip-buying following a 35% monthly decline. The company is set to report its third-quarter 2026 earnings on November 12, with consensus projecting a loss per share. Additional developments include Sumitomo Mitsui Trust Group Inc. reducing its holdings by 5.3% in the recent quarter and the launch of live GPU spot pricing, reserve auctions, and a capacity rebate program for AI cloud customers, accompanied by expanded builder grants across Europe. Analyst coverage has remained positive, though price action has remained under broader selling pressure.
Bearish structure holds as sellers dominate and momentum turns negative
Nebius Group is trading well below its 20-, 50-, and 200-day moving averages at $179.55, $206.99, and $177.9. This setup reflects short-, medium-, and long-term pressure from sellers, with a bearish technical structure maintained despite a long-term bullish alignment between the 50- and 200-day moving averages. The nearest resistance is the ceiling at $143.71, with a support floor at $140.6, resulting in a narrow trading zone. Major momentum indicators are negative: both the MACD and Average Directional Index suggest further downside risk. The Relative Strength Index, Stochastic RSI, and Commodity Channel Index are neutral, neither overbought nor oversold. Bearish pressure is highlighted by negative Bull/Bear Power and a confirming signal from the Awesome Oscillator. The session opened with a marked downside gap and high intraday volatility, with sellers in control and no reversal yet evident.
Earlier, analysts noted that neocloud operators like Nebius Group face increasing scrutiny due to the sector's debt-heavy growth model and the risks posed by rapid GPU depreciation and financing constraints. The latest technical and trading developments for NBIS reinforce these concerns, making the $140.60 support floor a critical level to watch in the coming sessions for signs of further downside risk.






Latest Nebius Group N.V. News




-
 Afghanistan
-
 Albania
-
 Algeria
-
 Angola
-
 Argentina
-
 Armenia
-
 Australia
-
 Austria
-
 Azerbaijan
-
 Bahamas
-
 Bahrain
-
 Bangladesh
-
 Belarus
-
 Belgium
-
 Bolivia
-
 Botswana
-
 Brazil
-
 Brunei
-
 Bulgaria
-
 Cambodia
-
 Cameroon
-
 Canada
-
 Chile
-
 China
-
 Colombia
-
 Congo
-
 Costa Rica
-
 Cote d'Ivoire
-
 Croatia
-
 Cuba
-
 Cyprus
-
 Czechia
-
 DR Congo
-
 Denmark
-
 Dominican Republic
-
 Ecuador
-
 Egypt
-
 El Salvador
-
 Estonia
-
 Eswatini
-
 Ethiopia
-
 Finland
-
 France
-
 Georgia
-
 Germany
-
 Ghana
-
 Greece
-
 Haiti
-
 Hong Kong
-
 Hungary
-
 India
-
 Indonesia
-
 Iran, Islamic republic
-
 Iraq
-
 Ireland
-
 Israel
-
 Italy
-
 Jamaica
-
 Japan
-
 Jordan
-
 Kazakhstan
-
 Kenya
-
 Korea
-
 Kuwait
-
 Kyrgyzstan
-
 Laos
-
 Latvia
-
 Lebanon
-
 Lesotho
-
 Libya
-
 Lithuania
-
 Luxembourg
-
 Madagascar
-
 Malaysia
-
 Malta
-
 Mauritius
-
 Mexico
-
 Moldova
-
 Mongolia
-
 Montenegro
-
 Morocco
-
 Mozambique
-
 Myanmar
-
 Namibia
-
 Nepal
-
 Netherlands
-
 New Zealand
-
 Nigeria
-
 North Macedonia
-
 Norway
-
 Oman
-
 Pakistan
-
 Palestine
-
 Panama
-
 Papua New Guinea
-
 Paraguay
-
 Peru
-
 Philippines
-
 Poland
-
 Portugal
-
 Puerto Rico
-
 Qatar
-
 Reunion
-
 Romania
-
 Rwanda
-
 Saudi Arabia
-
 Serbia
-
 Singapore
-
 Slovakia
-
 Slovenia
-
 Somalia
-
 South Africa
-
 Spain
-
 Sri Lanka
-
 Sweden
-
 Switzerland
-
 Syria
-
 Taiwan
-
 Tajikistan
-
 Tanzania
-
 Thailand
-
 Trinidad and Tobago
-
 Tunisia
-
 Turkey
-
 UAE
-
 Uganda
-
 Ukraine
-
 United Kingdom
-
United States
-
 Uruguay
-
 Uzbekistan
-
 Venezuela
-
 Vietnam
-
 Yemen
-
 Zambia
-
 Zimbabwe
- Forex
- Crypto












