

Apple raises $7.5 billion in bonds: Can AAPL stock avoid further downside?

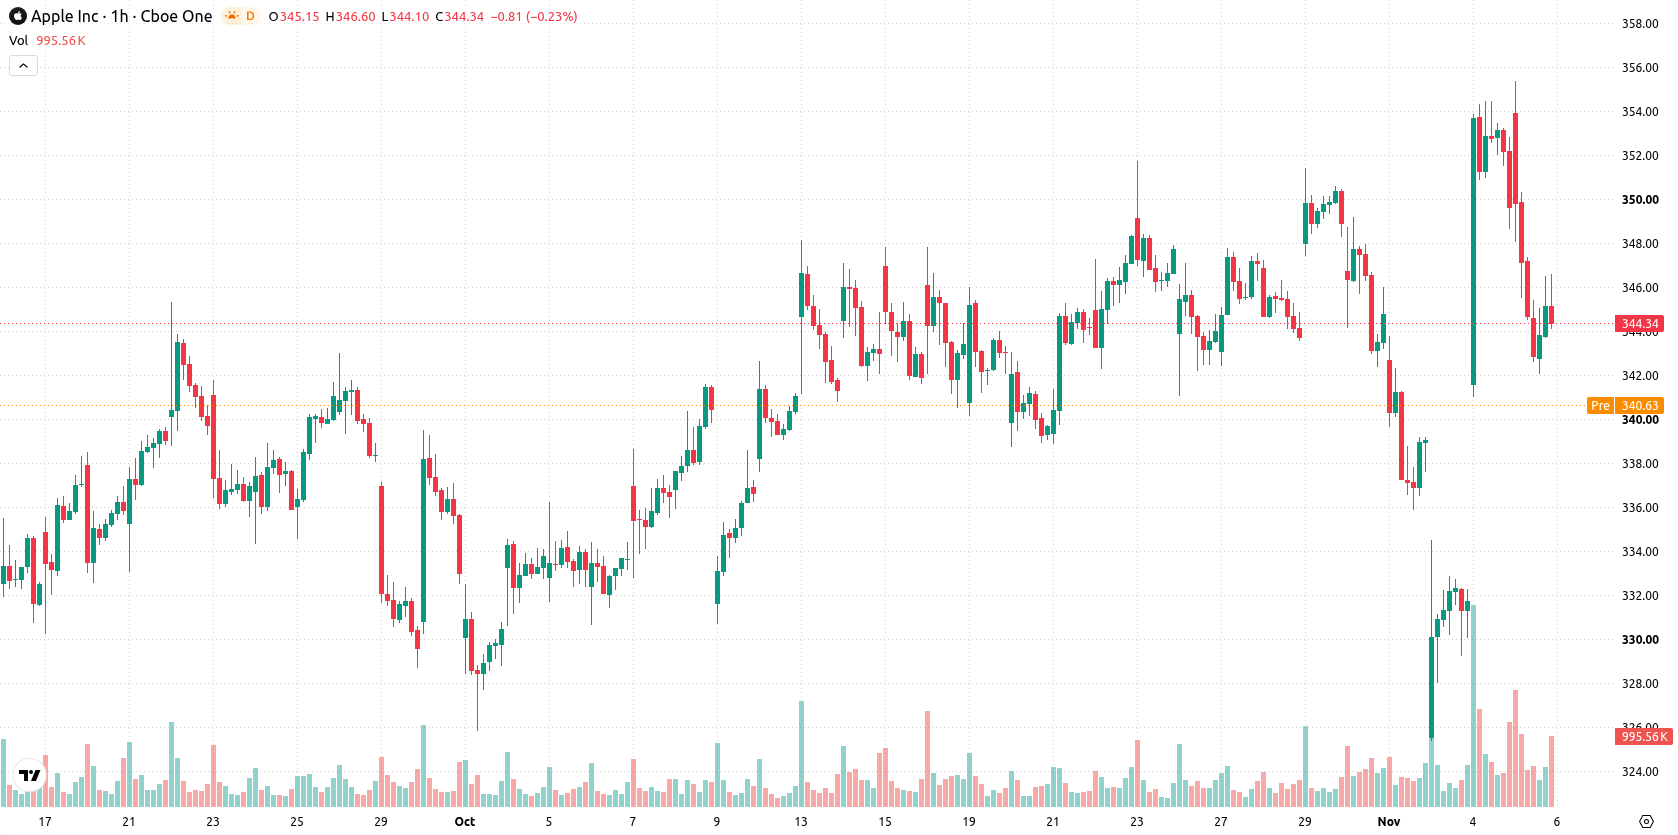
Apple Inc. (AAPL) stock is trading at $344.6, declining 1.4% on the day. The price remains above its key short-, medium-, and long-term moving averages, signaling persistent positive momentum across multiple timeframes.
 345.79
354.44
Highlights
- Apple raised $7.5 billion through a seven-tranche bond offering, expanding its options for capital allocation and corporate activities.
- Quarterly revenue increased 12% to $114.48 billion, with EPS up 14%, but margin compression and slowing service revenue growth add caution.
- Apple stock trades within a $332.4 to $356.8 range with 67% probability of a move higher, but high volatility and recent declines signal continued selling pressure.
Funding flexibility expands as margin concerns and AI risks emerge
Apple raised $7.5 billion through a high-grade, seven-tranche bond offering to fund general corporate purposes, including share buybacks, dividends, acquisitions, and debt repayment, according to Bloomberg. This capital injection expands the company’s financial flexibility, enabling various capital allocation paths but also focusing attention on future deployment decisions. While Apple reported quarterly revenue growth of 12% to $114.48 billion and a 14% rise in earnings per share, concerns about gross margin compression and slowing service revenue growth have added caution to the outlook. The company’s recent SEC filing flagged new regulatory risks around autonomous AI agent technologies, and Apple declared a dividend for the period including November 6, 2026, as reported by Seeking Alpha.
Mixed momentum signals as selling pressure tests support levels
On the technical front, AAPL/USD is situated above the MA-20 and MA-50 on the hourly chart, as well as the MA-200 on the daily timeframe. The immediate Ichimoku Kijun support level is at $340.36. Momentum indicators present a split view: MACD signals strong buy momentum, while ADX suggests sell conditions. RSI and CCI remain neutral, but the Stoch RSI is in the oversold zone, hinting at short-term rebound potential. Bull/Bear Power indicates a slight intraday advantage to buyers, and the Awesome Oscillator remains neutral. Today’s action saw AAPL/USD fall by 1.4%, closing near the daily low amid elevated volatility, confirming underlying selling pressure.
Sideways consolidation likely as volatility defines trading range
In the short term, AAPL/USD is expected to trade within the $332.4 to $356.8 range, reflecting typical volatility relative to current levels. There is a 67% probability for upward movement versus a 33% chance of further decline. The most likely scenario is sideways consolidation inside this range. A clear breakout above resistance could propel price toward the upper band, while a breach of support near $332.4 would open the way to further downside.
Earlier, analysts noted that Apple’s strong performance in fiscal 2026 could face increased pressure in 2027 from tougher year-over-year comparisons and rising component costs. The current technical setup, alongside recent fundamental developments, underscores the importance of the $332.4 support level as a potential pivot point for assessing near-term downside risk.











-
 Afghanistan
-
 Albania
-
 Algeria
-
 Angola
-
 Argentina
-
 Armenia
-
 Australia
-
 Austria
-
 Azerbaijan
-
 Bahamas
-
 Bahrain
-
 Bangladesh
-
 Belarus
-
 Belgium
-
 Bolivia
-
 Botswana
-
 Brazil
-
 Brunei
-
 Bulgaria
-
 Cambodia
-
 Cameroon
-
 Canada
-
 Chile
-
 China
-
 Colombia
-
 Congo
-
 Costa Rica
-
 Cote d'Ivoire
-
 Croatia
-
 Cuba
-
 Cyprus
-
 Czechia
-
 DR Congo
-
 Denmark
-
 Dominican Republic
-
 Ecuador
-
 Egypt
-
 El Salvador
-
 Estonia
-
 Eswatini
-
 Ethiopia
-
 Finland
-
 France
-
 Georgia
-
 Germany
-
 Ghana
-
 Greece
-
 Haiti
-
 Hong Kong
-
 Hungary
-
 India
-
 Indonesia
-
 Iran, Islamic republic
-
 Iraq
-
 Ireland
-
 Israel
-
 Italy
-
 Jamaica
-
 Japan
-
 Jordan
-
 Kazakhstan
-
 Kenya
-
 Korea
-
 Kuwait
-
 Kyrgyzstan
-
 Laos
-
 Latvia
-
 Lebanon
-
 Lesotho
-
 Libya
-
 Lithuania
-
 Luxembourg
-
 Madagascar
-
 Malaysia
-
 Malta
-
 Mauritius
-
 Mexico
-
 Moldova
-
 Mongolia
-
 Montenegro
-
 Morocco
-
 Mozambique
-
 Myanmar
-
 Namibia
-
 Nepal
-
 Netherlands
-
 New Zealand
-
 Nigeria
-
 North Macedonia
-
 Norway
-
 Oman
-
 Pakistan
-
 Palestine
-
 Panama
-
 Papua New Guinea
-
 Paraguay
-
 Peru
-
 Philippines
-
 Poland
-
 Portugal
-
 Puerto Rico
-
 Qatar
-
 Reunion
-
 Romania
-
 Rwanda
-
 Saudi Arabia
-
 Serbia
-
 Singapore
-
 Slovakia
-
 Slovenia
-
 Somalia
-
 South Africa
-
 Spain
-
 Sri Lanka
-
 Sweden
-
 Switzerland
-
 Syria
-
 Taiwan
-
 Tajikistan
-
 Tanzania
-
 Thailand
-
 Trinidad and Tobago
-
 Tunisia
-
 Turkey
-
 UAE
-
 Uganda
-
 Ukraine
-
 United Kingdom
-
United States
-
 Uruguay
-
 Uzbekistan
-
 Venezuela
-
 Vietnam
-
 Yemen
-
 Zambia
-
 Zimbabwe
- Forex
- Crypto












