

Can record Q3 earnings support Suncor Energy stock?

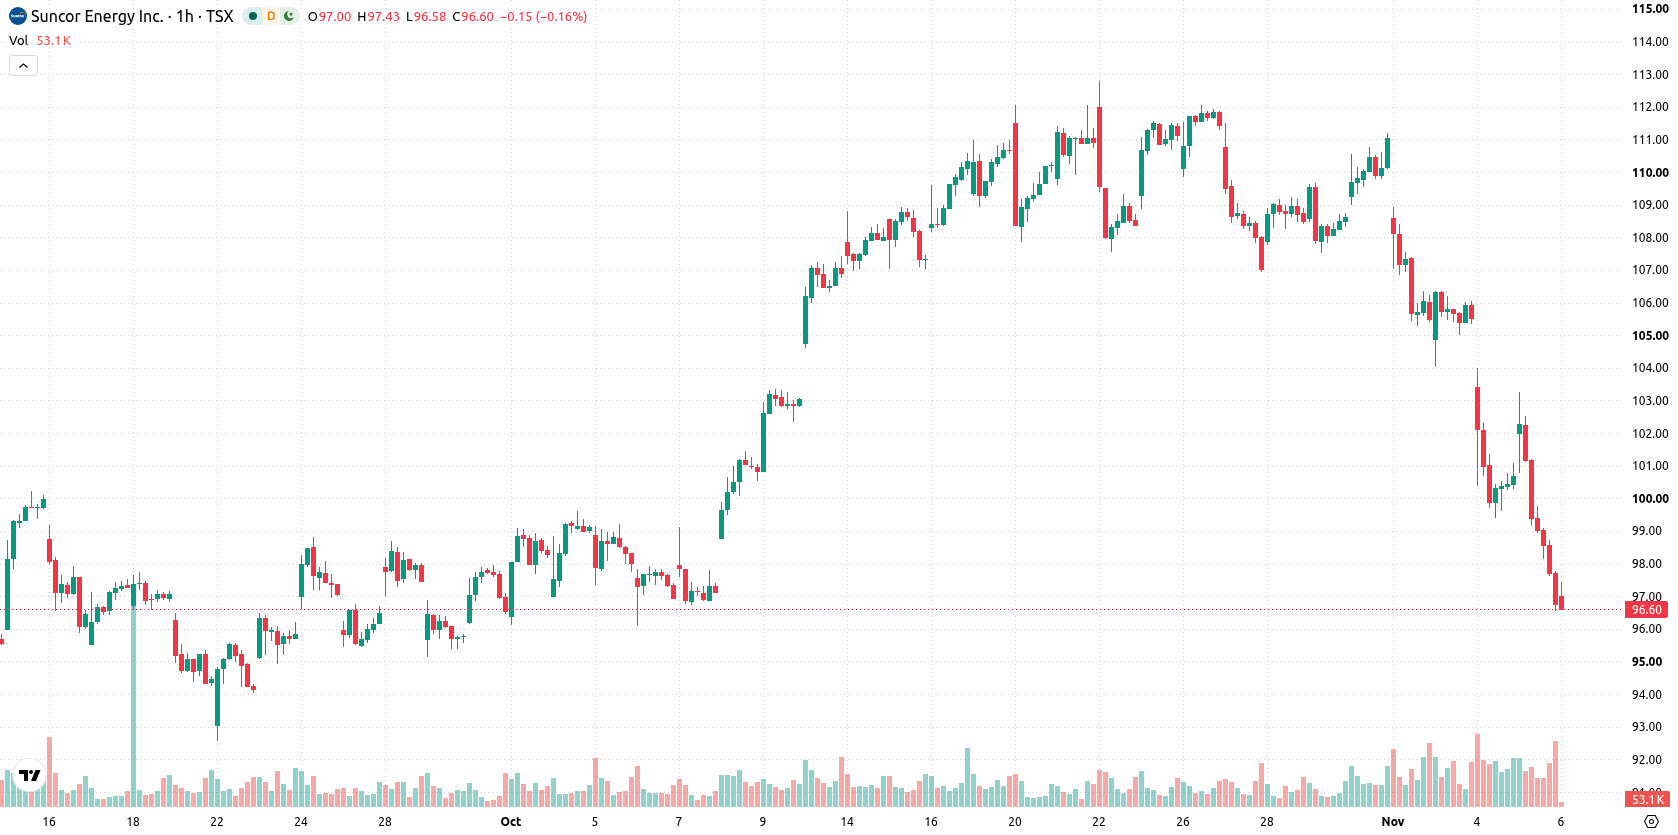
Suncor Energy (SU) stock is trading at C$97.23 after a modest gain today, closing near the high end of its daily range. The price remains below short- and medium-term moving averages, while still holding above longer-term trend measures.
 99.76
99.76
Highlights
- Suncor Energy posted record Q3 2026 results with adjusted funds from operations at $6.7 billion and net earnings of $3.8 billion.
- The company increased its quarterly dividend by 10% to $0.66 per share and sold non-core offshore assets for $1.2 billion upfront.
- Shares of Suncor Energy face prevailing bearish technical signals, trading below key averages and expected to range from C$91.75 to C$102.71.
Record Q3 results fuel cash returns and asset divestments
Suncor Energy reported record financial results for Q3 2026, with adjusted funds from operations reaching $6.7 billion, free funds flow at $5.2 billion, and net earnings of $3.8 billion. These figures reflect strong operational execution, particularly as an 80% surge in refined product exports, driven by global fuel shortages, contributed substantially to revenue growth. The company also raised its quarterly dividend by 10% to $0.66 per share and returned over $2 billion to shareholders, further highlighting robust cash generation and active capital return. In addition, Suncor agreed to sell non-core East Coast offshore assets for $1.2 billion upfront, providing immediate balance sheet flexibility.
Bearish momentum firms as short-term pressure overtakes oversold readings
On the hourly chart, SU trades below the MA-20 and MA-50, highlighting downward pressure on short- and medium-term timeframes. However, the price remains above the MA-200 on the daily chart, and the Ichimoku Kijun at C$102.06 serves as immediate resistance. All three oscillators—RSI, Stochastic RSI, and CCI—are currently in oversold zones, while momentum indicators such as MACD and ADX remain in negative territory. Bull/Bear Power measures at -2.35, and the Awesome Oscillator continues to support the prevailing bearish momentum, indicating sellers are still in control.
Downside risk elevated as consolidation and resistance limit upside
In the short term, the expected trading range for SU is projected between C$91.75 and C$102.71, reflecting typical volatility relative to current levels. The base case is for price consolidation within this corridor as sentiment digests recent movement and oversold technicals. An upward move would require a decisive break above the Ichimoku Kijun resistance at C$102.06, while further selling could push SU toward support near the lower edge of the forecasted band. Probabilities currently favor a downward move, with a 79% likelihood, suggesting risk is skewed to the downside in the near term.
In a recent review, analysts emphasized Suncor Energy's ongoing short- and medium-term technical weakness despite its strong financial performance and increased shareholder returns. The current analysis adds weight to this cautious outlook, with the prevailing scenario remaining bearish and suggesting heightened attention to downside risk if support near C$91.75 is breached.






Latest Suncor Energy News


-
 Afghanistan
-
 Albania
-
 Algeria
-
 Angola
-
 Argentina
-
 Armenia
-
 Australia
-
 Austria
-
 Azerbaijan
-
 Bahamas
-
 Bahrain
-
 Bangladesh
-
 Belarus
-
 Belgium
-
 Bolivia
-
 Botswana
-
 Brazil
-
 Brunei
-
 Bulgaria
-
 Cambodia
-
 Cameroon
-
 Canada
-
 Chile
-
 China
-
 Colombia
-
 Congo
-
 Costa Rica
-
 Cote d'Ivoire
-
 Croatia
-
 Cuba
-
 Cyprus
-
 Czechia
-
 DR Congo
-
 Denmark
-
 Dominican Republic
-
 Ecuador
-
 Egypt
-
 El Salvador
-
 Estonia
-
 Eswatini
-
 Ethiopia
-
 Finland
-
 France
-
 Georgia
-
 Germany
-
 Ghana
-
 Greece
-
 Haiti
-
 Hong Kong
-
 Hungary
-
 India
-
 Indonesia
-
 Iran, Islamic republic
-
 Iraq
-
 Ireland
-
 Israel
-
 Italy
-
 Jamaica
-
 Japan
-
 Jordan
-
 Kazakhstan
-
 Kenya
-
 Korea
-
 Kuwait
-
 Kyrgyzstan
-
 Laos
-
 Latvia
-
 Lebanon
-
 Lesotho
-
 Libya
-
 Lithuania
-
 Luxembourg
-
 Madagascar
-
 Malaysia
-
 Malta
-
 Mauritius
-
 Mexico
-
 Moldova
-
 Mongolia
-
 Montenegro
-
 Morocco
-
 Mozambique
-
 Myanmar
-
 Namibia
-
 Nepal
-
 Netherlands
-
 New Zealand
-
 Nigeria
-
 North Macedonia
-
 Norway
-
 Oman
-
 Pakistan
-
 Palestine
-
 Panama
-
 Papua New Guinea
-
 Paraguay
-
 Peru
-
 Philippines
-
 Poland
-
 Portugal
-
 Puerto Rico
-
 Qatar
-
 Reunion
-
 Romania
-
 Rwanda
-
 Saudi Arabia
-
 Serbia
-
 Singapore
-
 Slovakia
-
 Slovenia
-
 Somalia
-
 South Africa
-
 Spain
-
 Sri Lanka
-
 Sweden
-
 Switzerland
-
 Syria
-
 Taiwan
-
 Tajikistan
-
 Tanzania
-
 Thailand
-
 Trinidad and Tobago
-
 Tunisia
-
 Turkey
-
 UAE
-
 Uganda
-
 Ukraine
-
 United Kingdom
-
United States
-
 Uruguay
-
 Uzbekistan
-
 Venezuela
-
 Vietnam
-
 Yemen
-
 Zambia
-
 Zimbabwe
- Forex
- Crypto












