

Suncor Energy shares fall over 2% as record Q3 results and buyback expansion fail to offset selling pressure

Suncor Energy Inc. (SU) slid 2.00% in response to persistent selling pressure, even as the company reported record Q3 results and a more aggressive buyback schedule. The bearish move is reinforced by SU’s position below its 20-day and 50-day moving averages, which signals continued short- and medium-term weakness despite long-term support above the 200-day average.
 98.62
108.81
Highlights
- Suncor Energy delivered record adjusted funds from operations of CAD 6.7 billion and free funds flow of CAD 5.2 billion in Q3 2026.
- The company increased its quarterly dividend by 10% to CAD 0.66 per share and expanded its monthly share buyback program to CAD 750 million.
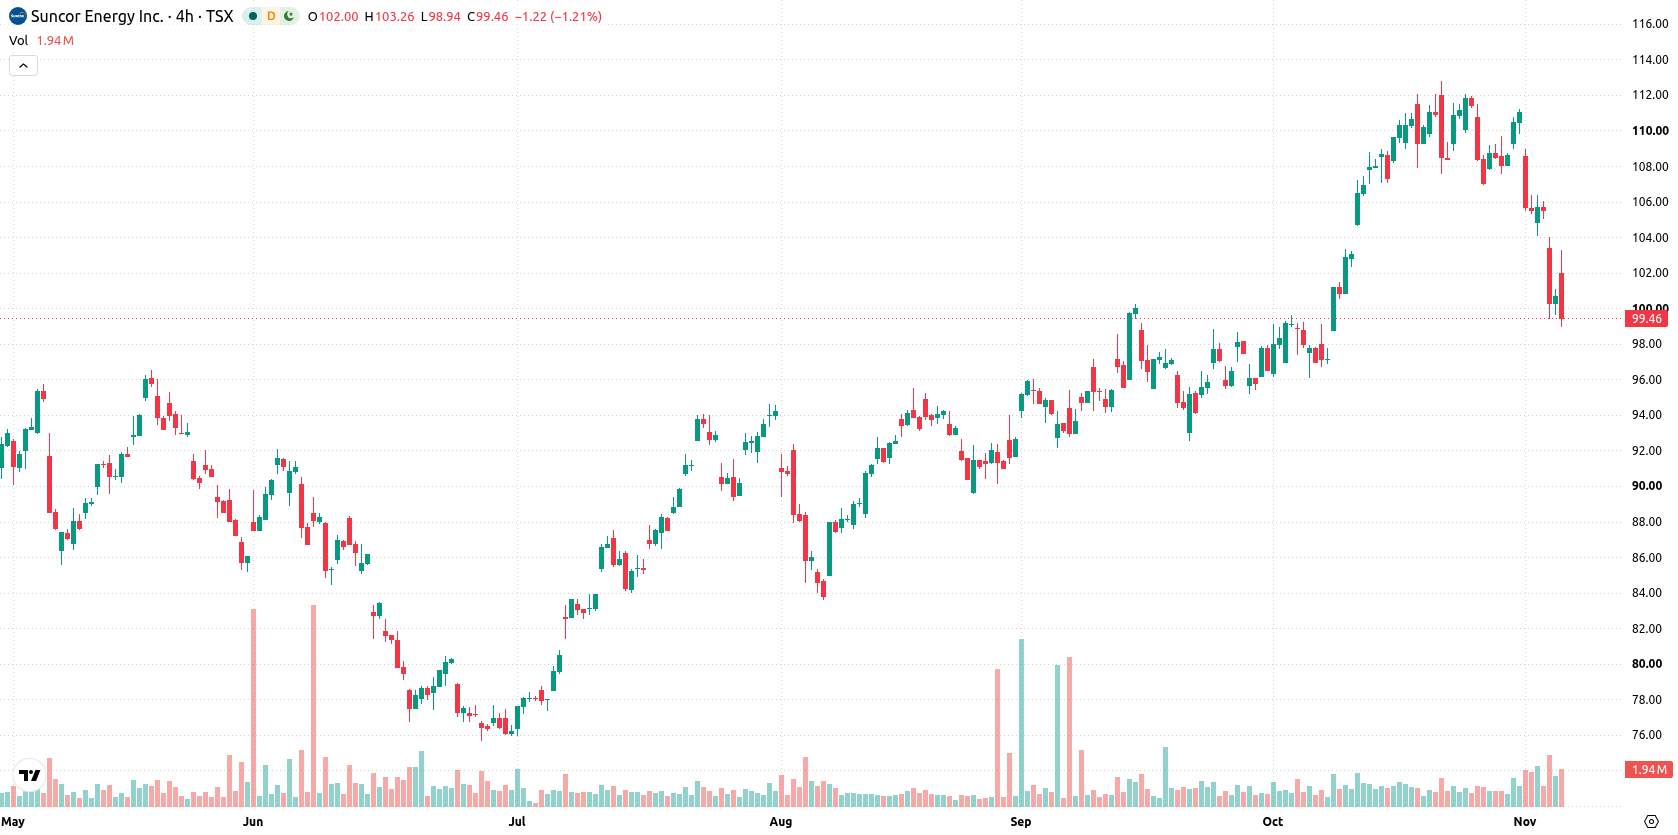
- Shares of Suncor Energy last closed at CAD 98.82 after a 2% drop, with short-term technical indicators mixed and the expected five-day range between CAD 92.95 and CAD 104.69.
Selling pressure persists despite record cash flow and liability reduction
Suncor Energy reported record adjusted funds from operations of CAD 6.7 billion and free funds flow of CAD 5.2 billion for Q3 2026. The company increased its quarterly dividend by 10% to CAD 0.66 per share and expanded its monthly share buyback program from CAD 500 million to CAD 750 million, effective October 2026. Suncor also completed the sale of non-core East Coast offshore assets, reducing abandonment liabilities by CAD 1.4 billion and eliminating a CAD 500 million compliance obligation, though price action has remained under broader selling pressure.
Short-term weakness as technical signals and momentum diverge
Suncor Energy is trading below its 20-day (C$107.17) and 50-day (C$100.1) moving averages, which indicates short- and medium-term pressure from sellers, but remains above the 200-day (C$88.43), suggesting the long-term trend is still bullish. The nearest resistance stands at C$99.4, while immediate support is at C$92.95. Momentum signals are mixed: the MACD points to a strong buy, while the ADX reflects a sell bias, spotlighting weakening trend intensity. The RSI is neutral. Both the Stochastic RSI and CCI are in oversold territory, which may signal short-term selling exhaustion, while intraday momentum remains negative on Bull/Bear Power. The Awesome Oscillator reads neutral and does not confirm current trends.
Earlier, analysts noted that Suncor Energy faced ongoing technical weakness and subdued momentum despite demonstrating strong financial performance and returning capital to shareholders. The current analysis builds on this view with updated data, highlighting that a decisive move above C$104.69 or below C$92.95 will be key in determining Suncor's next directional trend.






Latest Suncor Energy News


-
 Afghanistan
-
 Albania
-
 Algeria
-
 Angola
-
 Argentina
-
 Armenia
-
 Australia
-
 Austria
-
 Azerbaijan
-
 Bahamas
-
 Bahrain
-
 Bangladesh
-
 Belarus
-
 Belgium
-
 Bolivia
-
 Botswana
-
 Brazil
-
 Brunei
-
 Bulgaria
-
 Cambodia
-
 Cameroon
-
 Canada
-
 Chile
-
 China
-
 Colombia
-
 Congo
-
 Costa Rica
-
 Cote d'Ivoire
-
 Croatia
-
 Cuba
-
 Cyprus
-
 Czechia
-
 DR Congo
-
 Denmark
-
 Dominican Republic
-
 Ecuador
-
 Egypt
-
 El Salvador
-
 Estonia
-
 Eswatini
-
 Ethiopia
-
 Finland
-
 France
-
 Georgia
-
 Germany
-
 Ghana
-
 Greece
-
 Haiti
-
 Hong Kong
-
 Hungary
-
 India
-
 Indonesia
-
 Iran, Islamic republic
-
 Iraq
-
 Ireland
-
 Israel
-
 Italy
-
 Jamaica
-
 Japan
-
 Jordan
-
 Kazakhstan
-
 Kenya
-
 Korea
-
 Kuwait
-
 Kyrgyzstan
-
 Laos
-
 Latvia
-
 Lebanon
-
 Lesotho
-
 Libya
-
 Lithuania
-
 Luxembourg
-
 Madagascar
-
 Malaysia
-
 Malta
-
 Mauritius
-
 Mexico
-
 Moldova
-
 Mongolia
-
 Montenegro
-
 Morocco
-
 Mozambique
-
 Myanmar
-
 Namibia
-
 Nepal
-
 Netherlands
-
 New Zealand
-
 Nigeria
-
 North Macedonia
-
 Norway
-
 Oman
-
 Pakistan
-
 Palestine
-
 Panama
-
 Papua New Guinea
-
 Paraguay
-
 Peru
-
 Philippines
-
 Poland
-
 Portugal
-
 Puerto Rico
-
 Qatar
-
 Reunion
-
 Romania
-
 Rwanda
-
 Saudi Arabia
-
 Serbia
-
 Singapore
-
 Slovakia
-
 Slovenia
-
 Somalia
-
 South Africa
-
 Spain
-
 Sri Lanka
-
 Sweden
-
 Switzerland
-
 Syria
-
 Taiwan
-
 Tajikistan
-
 Tanzania
-
 Thailand
-
 Trinidad and Tobago
-
 Tunisia
-
 Turkey
-
 UAE
-
 Uganda
-
 Ukraine
-
 United Kingdom
-
United States
-
 Uruguay
-
 Uzbekistan
-
 Venezuela
-
 Vietnam
-
 Yemen
-
 Zambia
-
 Zimbabwe
- Forex
- Crypto












