

Will Suncor Energy stock hold steady amid seller pressure near C$105.27 resistance?

Suncor Energy (SU) stock is trading at C$101.79, posting a modest daily gain. The current price sits below its key short- and medium-term moving averages but remains above long-term support benchmarks.
 97.35
99.76
Highlights
- Suncor Energy increased its quarterly dividend by 10% to C$0.66 and authorized C$750 million in monthly share buybacks, directly raising shareholder returns.
- The company posted record adjusted funds from operations of C$6.7 billion and free funds flow of C$5.2 billion for the third quarter of 2026, despite a C$1.08 billion non-cash impairment linked to offshore divestiture plans.
- Shares of Suncor Energy trade below key short- and medium-term moving averages with bearish momentum signals, and are expected to range between C$96.58 and C$107 over the next several days.
Shareholder returns rise amid strong cash flow and portfolio shift
Suncor Energy raised its quarterly dividend by 10% to C$0.66 per share and expanded share buybacks to C$750 million per month, moves that directly increase returns to shareholders and can support demand for SU stock, according to Gurufocus. The company also reported record adjusted funds from operations of C$6.7 billion and free funds flow of C$5.2 billion in the third quarter of 2026, highlighting robust operational cash generation, as noted by Oilprice. Recent financial results were affected by a C$1.08 billion non-cash impairment tied to the planned divestiture of offshore assets, a transaction that is expected to bring in $1.2 billion in upfront proceeds and further streamline the company's portfolio, as reported by Gurufocus.
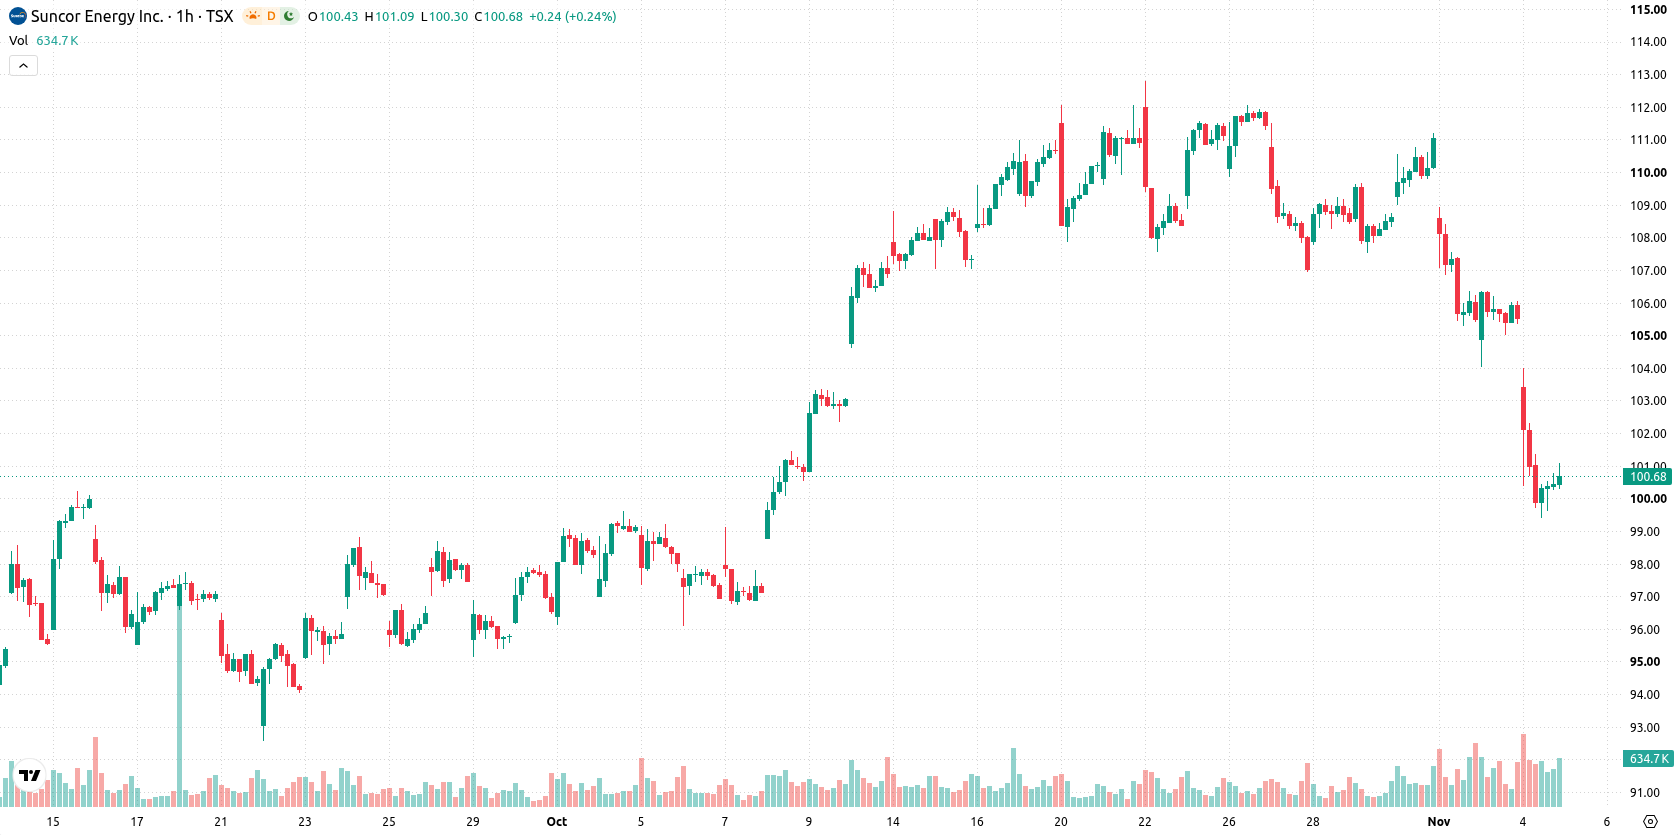
Mixed momentum as selling pressure meets oversold technicals
On the technical front, SU remains below its MA-20 at C$104.14 and MA-50 at C$107.06 on the hourly chart, but above the MA-200 at C$88.43 on the daily timeframe. Immediate resistance is noted at C$105.27, set by the Ichimoku Kijun. Momentum indicators send mixed signals—MACD and ADX are firmly on sell, while RSI is oversold and Stochastic RSI and CCI are neutral, suggesting the potential for a shift if selling pressure eases. Intraday action is dominated by sellers, as indicated by Bull/Bear Power at –1.63; the Awesome Oscillator is neutral, and overall volatility remains elevated.
Consolidation expected as breakout odds remain low
In the short term, SU is expected to consolidate within the C$96.58 to C$107 range, reflecting its current volatility band. The likelihood of an upside breakout is limited to 23%, so a continuation of sideways-to-downward movement is more probable. A close above resistance could trigger renewed buying momentum, while a break below C$96.58 would likely result in further declines.
Previously it was reported that Suncor Energy continued to experience short-term technical weakness and sustained selling pressure despite strong financial performance and enhanced shareholder returns. The current analysis reinforces this cautious outlook, highlighting that traders should monitor the C$96.58 level as a possible trigger for further downside risk.








-
 Afghanistan
-
 Albania
-
 Algeria
-
 Angola
-
 Argentina
-
 Armenia
-
 Australia
-
 Austria
-
 Azerbaijan
-
 Bahamas
-
 Bahrain
-
 Bangladesh
-
 Belarus
-
 Belgium
-
 Bolivia
-
 Botswana
-
 Brazil
-
 Brunei
-
 Bulgaria
-
 Cambodia
-
 Cameroon
-
 Canada
-
 Chile
-
 China
-
 Colombia
-
 Congo
-
 Costa Rica
-
 Cote d'Ivoire
-
 Croatia
-
 Cuba
-
 Cyprus
-
 Czechia
-
 DR Congo
-
 Denmark
-
 Dominican Republic
-
 Ecuador
-
 Egypt
-
 El Salvador
-
 Estonia
-
 Eswatini
-
 Ethiopia
-
 Finland
-
 France
-
 Georgia
-
 Germany
-
 Ghana
-
 Greece
-
 Haiti
-
 Hong Kong
-
 Hungary
-
 India
-
 Indonesia
-
 Iran, Islamic republic
-
 Iraq
-
 Ireland
-
 Israel
-
 Italy
-
 Jamaica
-
 Japan
-
 Jordan
-
 Kazakhstan
-
 Kenya
-
 Korea
-
 Kuwait
-
 Kyrgyzstan
-
 Laos
-
 Latvia
-
 Lebanon
-
 Lesotho
-
 Libya
-
 Lithuania
-
 Luxembourg
-
 Madagascar
-
 Malaysia
-
 Malta
-
 Mauritius
-
 Mexico
-
 Moldova
-
 Mongolia
-
 Montenegro
-
 Morocco
-
 Mozambique
-
 Myanmar
-
 Namibia
-
 Nepal
-
 Netherlands
-
 New Zealand
-
 Nigeria
-
 North Macedonia
-
 Norway
-
 Oman
-
 Pakistan
-
 Palestine
-
 Panama
-
 Papua New Guinea
-
 Paraguay
-
 Peru
-
 Philippines
-
 Poland
-
 Portugal
-
 Puerto Rico
-
 Qatar
-
 Reunion
-
 Romania
-
 Rwanda
-
 Saudi Arabia
-
 Serbia
-
 Singapore
-
 Slovakia
-
 Slovenia
-
 Somalia
-
 South Africa
-
 Spain
-
 Sri Lanka
-
 Sweden
-
 Switzerland
-
 Syria
-
 Taiwan
-
 Tajikistan
-
 Tanzania
-
 Thailand
-
 Trinidad and Tobago
-
 Tunisia
-
 Turkey
-
 UAE
-
 Uganda
-
 Ukraine
-
 United Kingdom
-
United States
-
 Uruguay
-
 Uzbekistan
-
 Venezuela
-
 Vietnam
-
 Yemen
-
 Zambia
-
 Zimbabwe
- Forex
- Crypto












