

Suncor Energy stock slides as seller pressure dominates short-term price action

Suncor Energy (SU) stock is trading at C$95.91, down 1.29% today. The price sits below its short- and medium-term moving averages but remains above its long-term average, indicating short-term selling pressure within a longer-term positive structure.
 96.30
106.33
Highlights
- Suncor Energy posted record third-quarter adjusted funds from operations of CAD 6.7 billion, indicating strong operating results and rising free cash flow.
- The company increased its dividend by 10% and authorized monthly share buybacks of CAD 750 million, returning over CAD 2 billion to shareholders.
- Shares of Suncor Energy trade under short- and medium-term selling pressure, with technical indicators forecasting a high probability of further downside within a C$91.42 to C$100.4 range.
Capital returns and record cash flow overshadowed by persistent selling pressure
Suncor Energy reported record third-quarter adjusted funds from operations of CAD 6.7 billion, indicating exceptional operating strength and a surge in free cash flow during the period. This financial performance enabled the company to raise its dividend by 10% and ramp up monthly share buybacks to CAD 750 million starting in October, adding direct capital returns for shareholders. In total, Suncor returned more than CAD 2 billion to investors through heightened share repurchases and increased dividends, according to Yahoo Finance, though price action has remained under broader selling pressure.
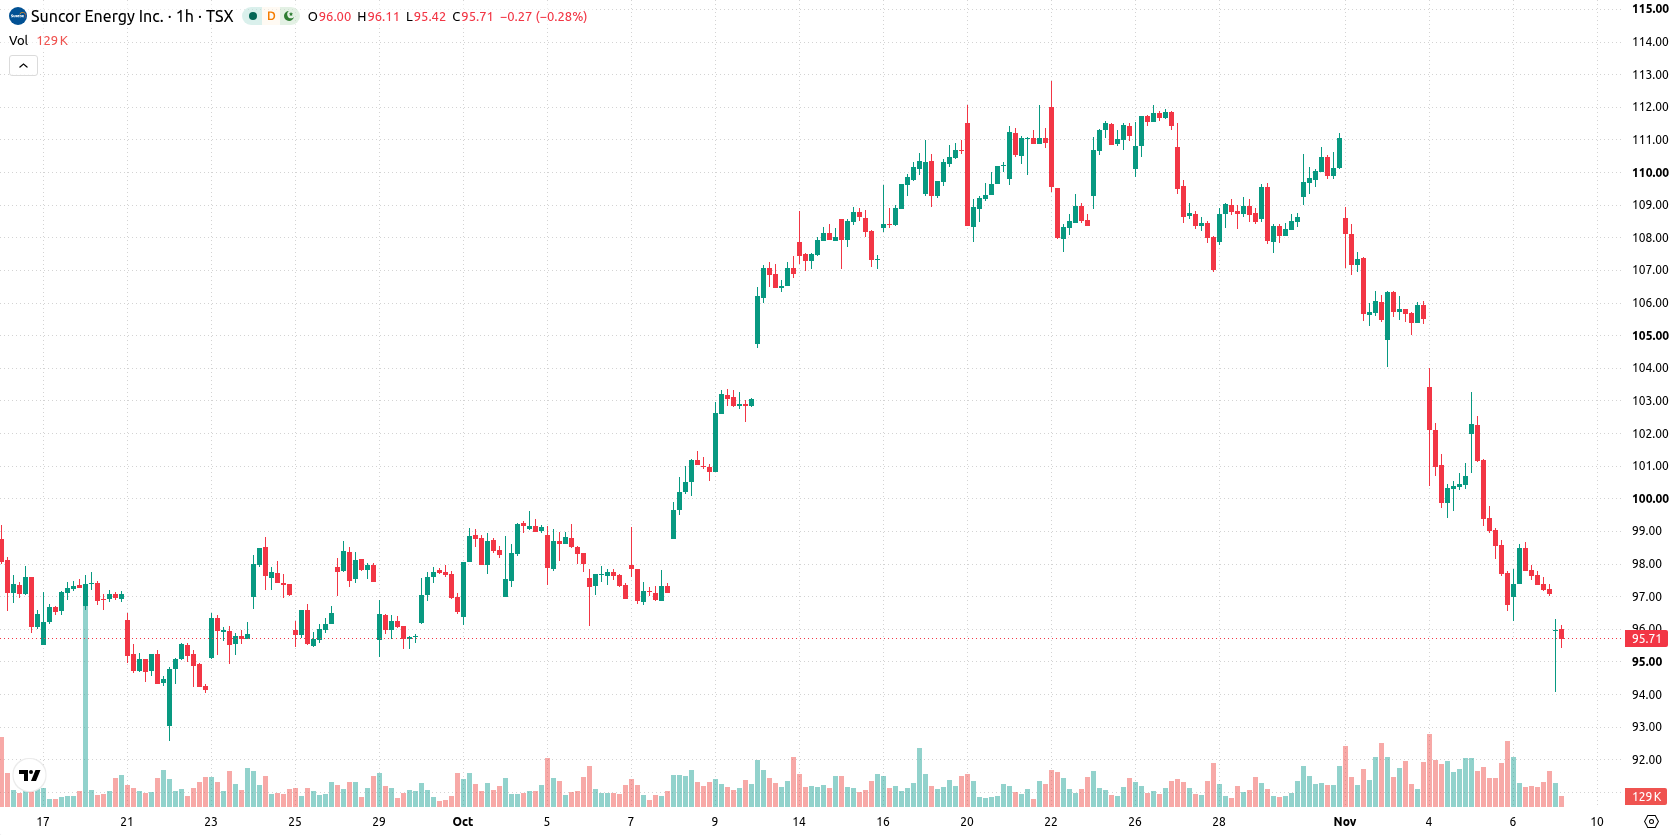
Bearish momentum as key moving averages cap upside
On the hourly chart, SU is trading below both its MA-20 at C$99.03 and MA-50 at C$104.15, with the daily MA-200 providing support at C$88.7. The Ichimoku Kijun level stands at C$101.22 and serves as immediate resistance. Momentum indicators present a strongly bearish intraday picture: MACD is on Strong Sell, ADX shows Sell conditions, and Bull/Bear Power registers at -0.97, confirming seller dominance for the session. The RSI is in the oversold zone, suggesting selling exhaustion could be near, while both Stoch RSI and CCI are neutral and the Awesome Oscillator remains flat.
Sideways movement favored as breakout risk remains minimal
In the short term, SU is expected to move within a forecast band of C$91.42 to C$100.4 over the next four trading days. The probability of an upward breakout is low, while downside risk remains pronounced. The base scenario envisions continued sideways movement within this volatility band, though a bullish reversal would require a decisive move above immediate resistance. More persistent weakness could develop if support at the lower bound is breached.
Earlier, analysts noted that despite Suncor Energy’s robust financial performance and shareholder returns, the stock continued to face near-term technical pressures and elevated downside risk. The current analysis reaffirms this cautious stance, with a broad volatility band in play and the C$91.42 level emerging as a critical threshold for potential further weakness.






Latest Suncor Energy News


-
 Afghanistan
-
 Albania
-
 Algeria
-
 Angola
-
 Argentina
-
 Armenia
-
 Australia
-
 Austria
-
 Azerbaijan
-
 Bahamas
-
 Bahrain
-
 Bangladesh
-
 Belarus
-
 Belgium
-
 Bolivia
-
 Botswana
-
 Brazil
-
 Brunei
-
 Bulgaria
-
 Cambodia
-
 Cameroon
-
 Canada
-
 Chile
-
 China
-
 Colombia
-
 Congo
-
 Costa Rica
-
 Cote d'Ivoire
-
 Croatia
-
 Cuba
-
 Cyprus
-
 Czechia
-
 DR Congo
-
 Denmark
-
 Dominican Republic
-
 Ecuador
-
 Egypt
-
 El Salvador
-
 Estonia
-
 Eswatini
-
 Ethiopia
-
 Finland
-
 France
-
 Georgia
-
 Germany
-
 Ghana
-
 Greece
-
 Haiti
-
 Hong Kong
-
 Hungary
-
 India
-
 Indonesia
-
 Iran, Islamic republic
-
 Iraq
-
 Ireland
-
 Israel
-
 Italy
-
 Jamaica
-
 Japan
-
 Jordan
-
 Kazakhstan
-
 Kenya
-
 Korea
-
 Kuwait
-
 Kyrgyzstan
-
 Laos
-
 Latvia
-
 Lebanon
-
 Lesotho
-
 Libya
-
 Lithuania
-
 Luxembourg
-
 Madagascar
-
 Malaysia
-
 Malta
-
 Mauritius
-
 Mexico
-
 Moldova
-
 Mongolia
-
 Montenegro
-
 Morocco
-
 Mozambique
-
 Myanmar
-
 Namibia
-
 Nepal
-
 Netherlands
-
 New Zealand
-
 Nigeria
-
 North Macedonia
-
 Norway
-
 Oman
-
 Pakistan
-
 Palestine
-
 Panama
-
 Papua New Guinea
-
 Paraguay
-
 Peru
-
 Philippines
-
 Poland
-
 Portugal
-
 Puerto Rico
-
 Qatar
-
 Reunion
-
 Romania
-
 Rwanda
-
 Saudi Arabia
-
 Serbia
-
 Singapore
-
 Slovakia
-
 Slovenia
-
 Somalia
-
 South Africa
-
 Spain
-
 Sri Lanka
-
 Sweden
-
 Switzerland
-
 Syria
-
 Taiwan
-
 Tajikistan
-
 Tanzania
-
 Thailand
-
 Trinidad and Tobago
-
 Tunisia
-
 Turkey
-
 UAE
-
 Uganda
-
 Ukraine
-
 United Kingdom
-
United States
-
 Uruguay
-
 Uzbekistan
-
 Venezuela
-
 Vietnam
-
 Yemen
-
 Zambia
-
 Zimbabwe
- Forex
- Crypto












