

Will Tesco stock break GBX577.28 resistance as buyer support persists?

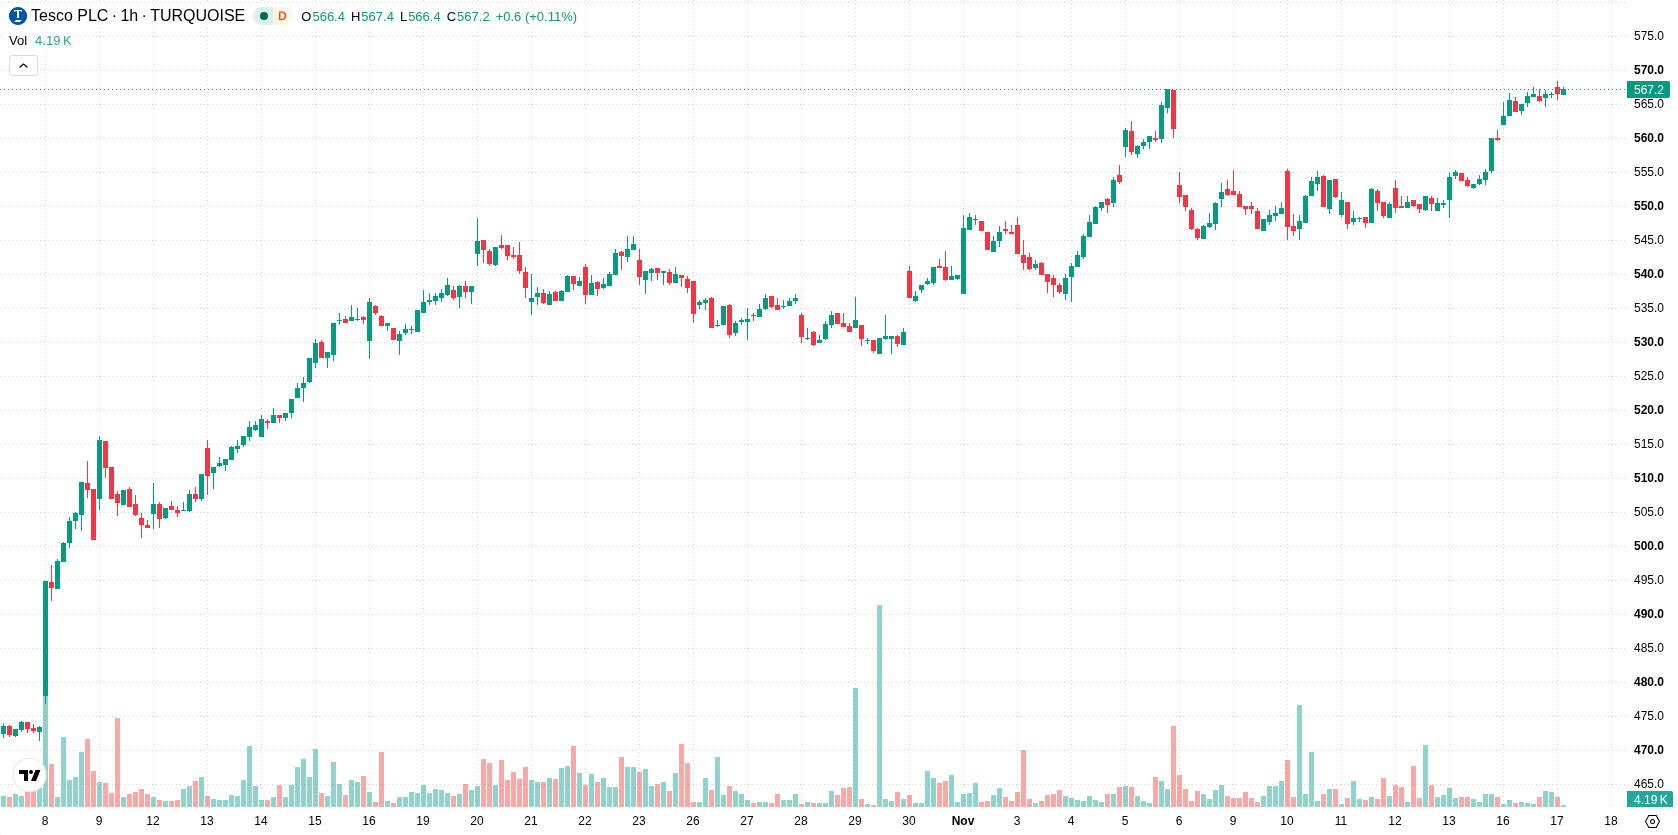
Tesco (TSCO) stock is trading at GBX567.8, posting a modest daily gain with a gap up and sitting near the session high. The price is holding above its key moving averages across both short and longer timeframes, signaling ongoing positive momentum.
 567.80
567.40
Highlights
- Tesco reported a 6.5% increase in adjusted operating profit year on year and a 21% rise in free cash flow.
- Tesco increased its H1 dividend by 5.2%, expanded share buybacks, and maintains a 2.63% yield on a 48.99% payout ratio.
- Shares of Tesco trade in a bullish structure with strong upward momentum and are expected to consolidate in the GBX558.32 to GBX577.28 range as overbought indicators suggest risk of a short-term correction.
Profit growth and capital returns drive investor reward focus
Tesco recorded a 6.5% year-on-year increase in adjusted operating profit over the past 12 months, reflecting improved operational performance and cost management, according to Yahoo Finance. The company also reported a 21% rise in free cash flow, giving it greater flexibility to pursue returns to shareholders and future investments. Recent actions, including a 5.2% increase in the H1 dividend and an expanded share buyback programme, directly reward investors, while a 2.63% dividend yield and a 48.99% payout ratio, as highlighted by Directorstalkinterviews, signal a continued commitment to sustainable capital returns.
Overbought signals raise correction risk amid strong buyer activity
On the technical front, TSCO is trading above the H1 SMA-20 at GBX560.24 and the H1 SMA-50 at GBX554.04, and remains well above the D1 SMA-200 at GBX479.67. The Ichimoku Kijun at GBX558.1 is identified as immediate support. MACD and ADX readings remain in Buy mode, while the RSI and Stochastic RSI are both in overbought territory, suggesting a risk of short-term correction or pullback. CCI is neutral, and Bull/Bear Power is strongly positive at 4.86, showing robust intraday buyer strength. The Awesome Oscillator is neutral and provides no additional momentum confirmation.
Bullish breakout probability rises as consolidation dominates outlook
In the near term, TSCO is likely to trade within the GBX558.32 to GBX577.28 price range, a typical volatility band relative to current levels. The baseline scenario sees consolidation inside this range. A bullish breakout above resistance would see price moving into the upper end of the range, while a drop below immediate support would open room for a correction from currently overbought conditions. The probability of an upside move in the next 2-3 trading days is estimated at more than 80%, with downside risk below 20%.
Earlier, analysts noted that Tesco shares were exhibiting sustained bullish momentum, supported by strong technical alignment and reliable capital returns. The current analysis reinforces this outlook with improved profitability and cash flow, suggesting traders should watch the GBX558.32 support and GBX577.28 resistance as the critical boundaries for near-term price action.






Latest Tesco News





-
 Afghanistan
-
 Albania
-
 Algeria
-
 Angola
-
 Argentina
-
 Armenia
-
 Australia
-
 Austria
-
 Azerbaijan
-
 Bahamas
-
 Bahrain
-
 Bangladesh
-
 Belarus
-
 Belgium
-
 Bolivia
-
 Botswana
-
 Brazil
-
 Brunei
-
 Bulgaria
-
 Cambodia
-
 Cameroon
-
 Canada
-
 Chile
-
 China
-
 Colombia
-
 Congo
-
 Costa Rica
-
 Cote d'Ivoire
-
 Croatia
-
 Cuba
-
 Cyprus
-
 Czechia
-
 DR Congo
-
 Denmark
-
 Dominican Republic
-
 Ecuador
-
 Egypt
-
 El Salvador
-
 Estonia
-
 Eswatini
-
 Ethiopia
-
 Finland
-
 France
-
 Georgia
-
 Germany
-
 Ghana
-
 Greece
-
 Haiti
-
 Hong Kong
-
 Hungary
-
 India
-
 Indonesia
-
 Iran, Islamic republic
-
 Iraq
-
 Ireland
-
 Israel
-
 Italy
-
 Jamaica
-
 Japan
-
 Jordan
-
 Kazakhstan
-
 Kenya
-
 Korea
-
 Kuwait
-
 Kyrgyzstan
-
 Laos
-
 Latvia
-
 Lebanon
-
 Lesotho
-
 Libya
-
 Lithuania
-
 Luxembourg
-
 Madagascar
-
 Malaysia
-
 Malta
-
 Mauritius
-
 Mexico
-
 Moldova
-
 Mongolia
-
 Montenegro
-
 Morocco
-
 Mozambique
-
 Myanmar
-
 Namibia
-
 Nepal
-
 Netherlands
-
 New Zealand
-
 Nigeria
-
 North Macedonia
-
 Norway
-
 Oman
-
 Pakistan
-
 Palestine
-
 Panama
-
 Papua New Guinea
-
 Paraguay
-
 Peru
-
 Philippines
-
 Poland
-
 Portugal
-
 Puerto Rico
-
 Qatar
-
 Reunion
-
 Romania
-
 Rwanda
-
 Saudi Arabia
-
 Serbia
-
 Singapore
-
 Slovakia
-
 Slovenia
-
 Somalia
-
 South Africa
-
 Spain
-
 Sri Lanka
-
 Sweden
-
 Switzerland
-
 Syria
-
 Taiwan
-
 Tajikistan
-
 Tanzania
-
 Thailand
-
 Trinidad and Tobago
-
 Tunisia
-
 Turkey
-
 UAE
-
 Uganda
-
 Ukraine
-
 United Kingdom
-
United States
-
 Uruguay
-
 Uzbekistan
-
 Venezuela
-
 Vietnam
-
 Yemen
-
 Zambia
-
 Zimbabwe
- Forex
- Crypto












