

Shell completes share cancellation: Can SHEL regain momentum?

Shell (SHEL) stock is trading at GBX3,680, reflecting a slight decline on the day and continuing to hold below its key short- and medium-term moving averages, while remaining above longer-term trend levels.
 3667.00
3752.00
Highlights
- Shell completed the purchase and cancellation of 1,203,000 sterling-denominated and 780,343 euro-denominated shares, reducing the number of shares outstanding.
- The reduction in share count is expected to structurally support per-share financial metrics, but recent trading impact is muted.
- Shares of Shell trade below key short- and medium-term technical levels with a high probability of further downside toward the GBX3,629 to GBX3,731 range over 2 to 3 days.
Share buyback cancellation tightens supply as market reaction stays muted
Shell plc recently completed the purchase and cancellation of 1,203,000 sterling-denominated shares and 780,343 euro-denominated shares across UK and European trading venues, according to Tipranks. This action directly reduces the number of shares outstanding, which can tighten the overall supply and gradually support per-share financial metrics. The cancellation may act as a structural factor in Shell's equity profile, though the immediate market impact appears muted amid lighter trading conditions.
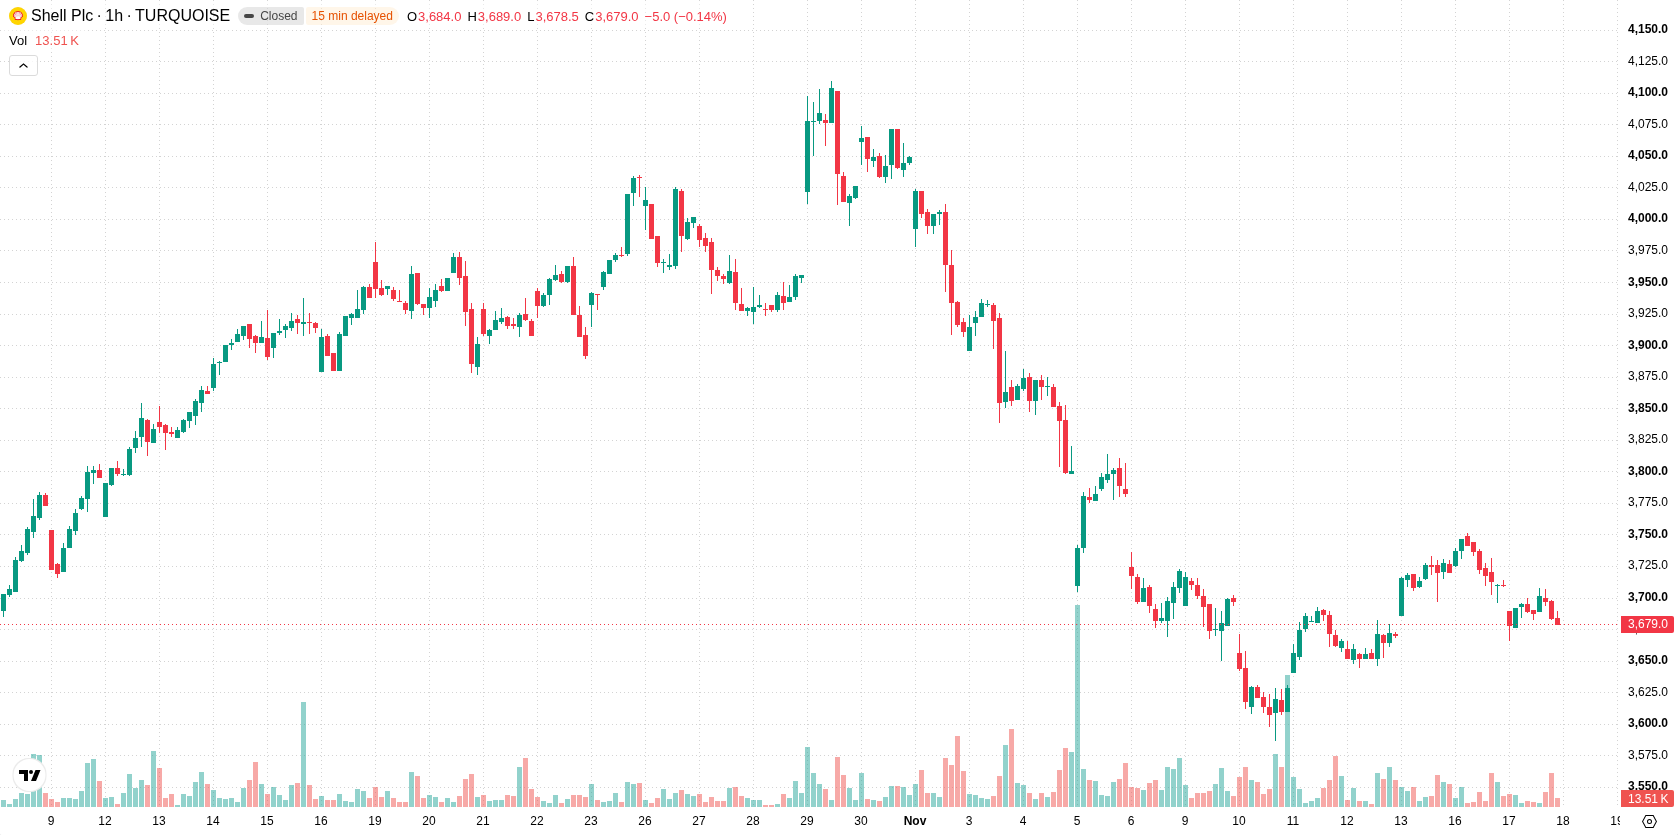
Bearish momentum dominates as price tests resistance and volatility remains low
Technically, Shell is trading below the H1 SMA-20 at GBX3,709 and H1 SMA-50 at GBX3,686, while still holding above the D1 SMA-200 at GBX3,339. The Ichimoku Kijun at GBX3,708 defines immediate resistance. MACD and ADX are both bearish, supporting a weak momentum environment this session. RSI and CCI remain neutral, whereas Stochastic RSI indicates oversold conditions, suggesting the potential for a rebound or at least a pause in selling, but not signaling a clear reversal. Bull/Bear Power is negative at -7.28, and the Awesome Oscillator confirms the ongoing weakness, while low intraday volatility leaves the overall technical picture mixed but tilted toward sellers.
Downside bias prevails as price faces resistance within tight volatility band
Over the next two to three sessions, Shell is projected to oscillate within a volatility band of GBX3,629 to GBX3,731. The scenario with the highest probability (over 80%) is further downside or consolidation within this corridor. There is a low probability (under 20%) of a sustained rebound unless the price breaks decisively above the Ichimoku Kijun resistance at GBX3,708. A move below support increases the risk of targeting the lower end of the forecast range.
Earlier, analysts noted that Shell's stock remained vulnerable to ongoing macroeconomic pressures, particularly amid heightened uncertainty around US monetary policy and global funding costs. The latest share cancellation adds a structural factor to the equity profile, but with technical indicators still bearish, the prevailing scenario calls for close monitoring of price action around the GBX3,708 resistance as a potential signal for directional change.









-
 Afghanistan
-
 Albania
-
 Algeria
-
 Angola
-
 Argentina
-
 Armenia
-
 Australia
-
 Austria
-
 Azerbaijan
-
 Bahamas
-
 Bahrain
-
 Bangladesh
-
 Belarus
-
 Belgium
-
 Bolivia
-
 Botswana
-
 Brazil
-
 Brunei
-
 Bulgaria
-
 Cambodia
-
 Cameroon
-
 Canada
-
 Chile
-
 China
-
 Colombia
-
 Congo
-
 Costa Rica
-
 Cote d'Ivoire
-
 Croatia
-
 Cuba
-
 Cyprus
-
 Czechia
-
 DR Congo
-
 Denmark
-
 Dominican Republic
-
 Ecuador
-
 Egypt
-
 El Salvador
-
 Estonia
-
 Eswatini
-
 Ethiopia
-
 Finland
-
 France
-
 Georgia
-
 Germany
-
 Ghana
-
 Greece
-
 Haiti
-
 Hong Kong
-
 Hungary
-
 India
-
 Indonesia
-
 Iran, Islamic republic
-
 Iraq
-
 Ireland
-
 Israel
-
 Italy
-
 Jamaica
-
 Japan
-
 Jordan
-
 Kazakhstan
-
 Kenya
-
 Korea
-
 Kuwait
-
 Kyrgyzstan
-
 Laos
-
 Latvia
-
 Lebanon
-
 Lesotho
-
 Libya
-
 Lithuania
-
 Luxembourg
-
 Madagascar
-
 Malaysia
-
 Malta
-
 Mauritius
-
 Mexico
-
 Moldova
-
 Mongolia
-
 Montenegro
-
 Morocco
-
 Mozambique
-
 Myanmar
-
 Namibia
-
 Nepal
-
 Netherlands
-
 New Zealand
-
 Nigeria
-
 North Macedonia
-
 Norway
-
 Oman
-
 Pakistan
-
 Palestine
-
 Panama
-
 Papua New Guinea
-
 Paraguay
-
 Peru
-
 Philippines
-
 Poland
-
 Portugal
-
 Puerto Rico
-
 Qatar
-
 Reunion
-
 Romania
-
 Rwanda
-
 Saudi Arabia
-
 Serbia
-
 Singapore
-
 Slovakia
-
 Slovenia
-
 Somalia
-
 South Africa
-
 Spain
-
 Sri Lanka
-
 Sweden
-
 Switzerland
-
 Syria
-
 Taiwan
-
 Tajikistan
-
 Tanzania
-
 Thailand
-
 Trinidad and Tobago
-
 Tunisia
-
 Turkey
-
 UAE
-
 Uganda
-
 Ukraine
-
 United Kingdom
-
United States
-
 Uruguay
-
 Uzbekistan
-
 Venezuela
-
 Vietnam
-
 Yemen
-
 Zambia
-
 Zimbabwe
- Forex
- Crypto












