

META trades sideways as consolidation near a key resistance level continues

Meta (META) stock is trading at $615.28, marking a modest decline on the day. The price remains below its key moving averages, pointing to ongoing downward pressure from sellers.
 620.81
643.77
Highlights
- Meta Platforms suspended its planned Class C non-voting share issuance as shareholder litigation continues in Delaware.
- The company’s existing voting structure remains unchanged, removing the risk of immediate dilution for shareholders until legal proceedings are resolved.
- Shares of Meta Platforms trade below major moving averages, with technical signals indicating strong bearish trend pressure and an expected range of $600.31 to $630.25.
Shareholder litigation delays new share class, stabilizing voting structure
Meta Platforms Inc. has paused its planned issuance of a new class of non-voting Class C shares due to ongoing shareholder litigation in Delaware, according to Yahoo Finance. The decision keeps the company's current voting structure intact, averting immediate dilution concerns that such a move might have triggered. This pause preserves the status quo for existing shareholders while the outcome of the legal proceedings remains pending.
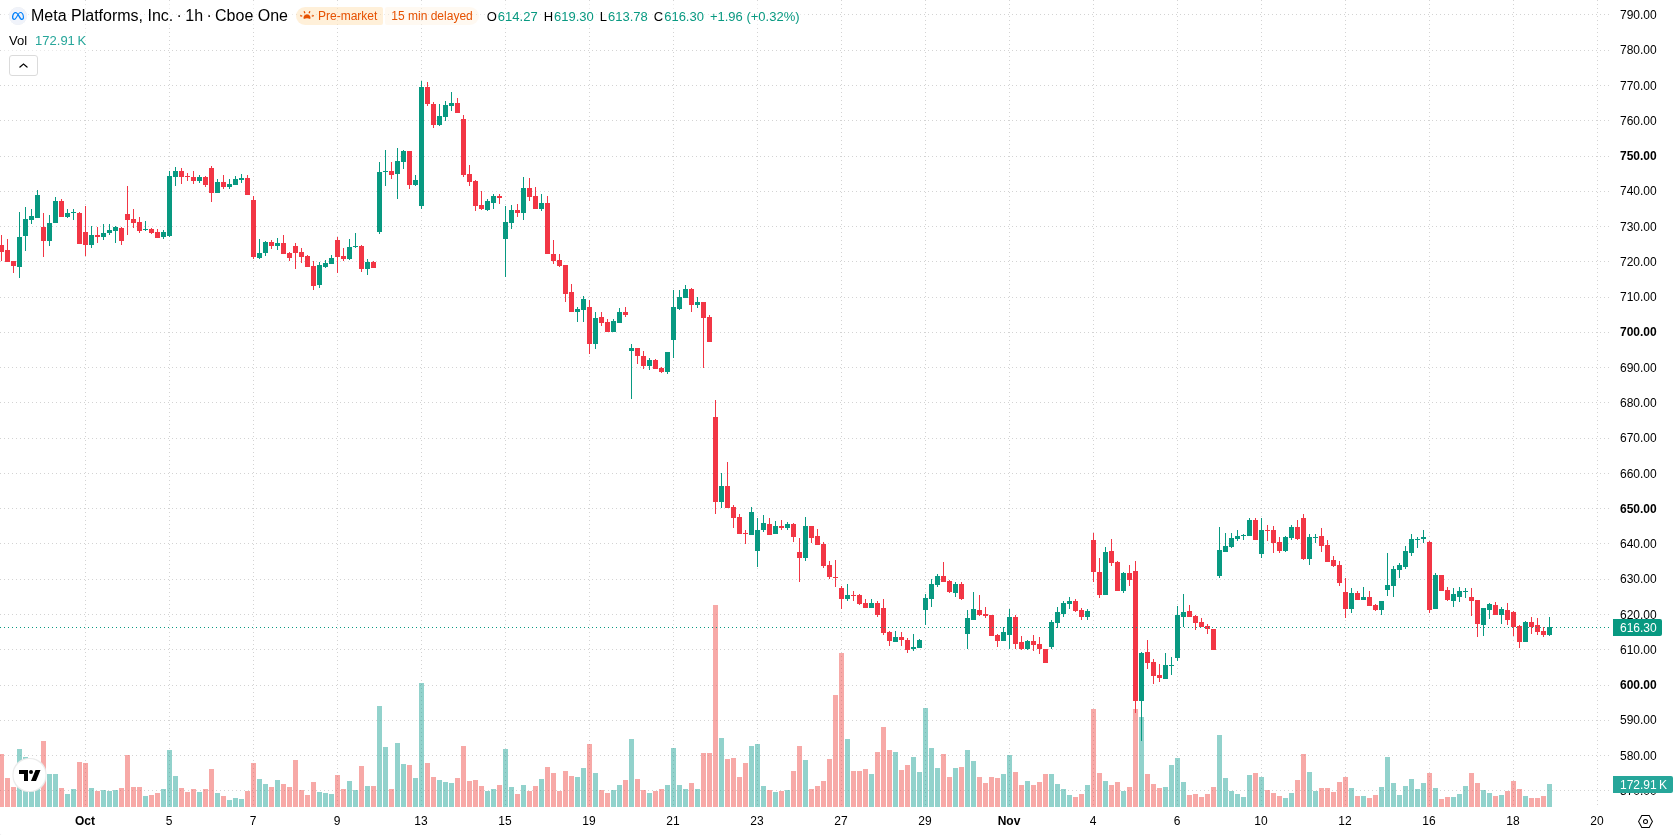
Intraday buyer attempts countered by resistance and mixed momentum
Technical analysis shows META trading under several notable resistance levels, with H1 SMA-20 at $620.11, H1 SMA-50 at $628.23, and D1 SMA-200 at $629.47, while the Ichimoku Kijun at $627.04 serves as immediate resistance. MACD and ADX currently signal a Sell bias, while the Awesome Oscillator remains neutral. RSI, Stoch RSI, and CCI are each neutral, indicating the absence of short-term extremes. Bull/Bear Power is modestly positive at 1.48, highlighting slight buyer momentum within the session, but mixed signals persist as intraday buying interest is met with broader trend weakness.
Low rebound odds as volatility range contains elevated downside risk
In the near term, META is expected to trade within the $600.31 to $630.25 band, a typical volatility corridor relative to current levels. The probability of a meaningful upward breakout is considered very low, while downside risk is elevated—making a sustained bounce unlikely in the immediate future. The most probable scenario is sideways movement within the stated range, with any fresh move depending on a clear resolution beyond either immediate resistance or support.
Earlier, analysts noted that Meta shares continued to face technical weakness with bearish momentum reinforcing downside risks. The current technical setup reaffirms ongoing pressure, with traders advised to monitor for a decisive move outside the $600.31 to $630.25 range as the next catalyst for price direction.






Latest META News





-
 Afghanistan
-
 Albania
-
 Algeria
-
 Angola
-
 Argentina
-
 Armenia
-
 Australia
-
 Austria
-
 Azerbaijan
-
 Bahamas
-
 Bahrain
-
 Bangladesh
-
 Belarus
-
 Belgium
-
 Bolivia
-
 Botswana
-
 Brazil
-
 Brunei
-
 Bulgaria
-
 Cambodia
-
 Cameroon
-
 Canada
-
 Chile
-
 China
-
 Colombia
-
 Congo
-
 Costa Rica
-
 Cote d'Ivoire
-
 Croatia
-
 Cuba
-
 Cyprus
-
 Czechia
-
 DR Congo
-
 Denmark
-
 Dominican Republic
-
 Ecuador
-
 Egypt
-
 El Salvador
-
 Estonia
-
 Eswatini
-
 Ethiopia
-
 Finland
-
 France
-
 Georgia
-
 Germany
-
 Ghana
-
 Greece
-
 Haiti
-
 Hong Kong
-
 Hungary
-
 India
-
 Indonesia
-
 Iran, Islamic republic
-
 Iraq
-
 Ireland
-
 Israel
-
 Italy
-
 Jamaica
-
 Japan
-
 Jordan
-
 Kazakhstan
-
 Kenya
-
 Korea
-
 Kuwait
-
 Kyrgyzstan
-
 Laos
-
 Latvia
-
 Lebanon
-
 Lesotho
-
 Libya
-
 Lithuania
-
 Luxembourg
-
 Madagascar
-
 Malaysia
-
 Malta
-
 Mauritius
-
 Mexico
-
 Moldova
-
 Mongolia
-
 Montenegro
-
 Morocco
-
 Mozambique
-
 Myanmar
-
 Namibia
-
 Nepal
-
 Netherlands
-
 New Zealand
-
 Nigeria
-
 North Macedonia
-
 Norway
-
 Oman
-
 Pakistan
-
 Palestine
-
 Panama
-
 Papua New Guinea
-
 Paraguay
-
 Peru
-
 Philippines
-
 Poland
-
 Portugal
-
 Puerto Rico
-
 Qatar
-
 Reunion
-
 Romania
-
 Rwanda
-
 Saudi Arabia
-
 Serbia
-
 Singapore
-
 Slovakia
-
 Slovenia
-
 Somalia
-
 South Africa
-
 Spain
-
 Sri Lanka
-
 Sweden
-
 Switzerland
-
 Syria
-
 Taiwan
-
 Tajikistan
-
 Tanzania
-
 Thailand
-
 Trinidad and Tobago
-
 Tunisia
-
 Turkey
-
 UAE
-
 Uganda
-
 Ukraine
-
 United Kingdom
-
United States
-
 Uruguay
-
 Uzbekistan
-
 Venezuela
-
 Vietnam
-
 Yemen
-
 Zambia
-
 Zimbabwe
- Forex
- Crypto












